To build a direct labor budget, forecast the work each period will bring, convert it into labor hours, and price those hours at a fully loaded rate.
The U.S. Bureau of Labor Statistics (BLS) Employment Cost Index reports private-industry compensation growth of 3.5% in retail, 3.7% in transportation and warehousing, and 2.5% in leisure and hospitality over the year ending September 2026. A budget built on last year’s wage rates and a fully staffed roster misses two costs: wage increases and the overtime paid to cover open positions.
Use six steps to turn demand into hours and loaded cost, then check actual spend against the plan every month.
What is a direct labor budget?
A direct labor budget is the plan for how many hours of direct labor each period’s output needs and what those hours will cost. It sits on top of the production or demand plan, so the right number of people is scheduled and the money to pay them is set aside.
Building one takes three moves:
- Count the work: Forecast the units each period will bring, such as orders picked, covers served, transactions rung or calls handled. Each role budgets against its own unit count.
- Convert units to hours: Multiply the units by the standard time each one takes: hours = units × standard hours per unit.
- Price the hours: Multiply those hours by the loaded hourly rate: cost = hours × hourly rate.
Say a warehouse expects 1,000 orders next week, and each order takes about 6 minutes. That’s 100 labor hours, and at a loaded rate of $36 an hour, the week’s direct labor budget is $3,600.
Settle scope before you calculate
Two scoping decisions come before the math: which roles count as direct labor, and where the budget sits in the planning sequence.
Direct labor vs. indirect labor
Direct labor is work you can trace to customer output; indirect labor supports operations without producing a specific order, meal or call. If a worker’s hours tie directly to the product or service, budget them as direct labor. If they tie to the site but not to a unit of output, they belong in overhead. Where that line falls varies from company to company, so write the rule down once.
Line cooks, warehouse pickers and contact center agents typically count as direct when you trace their hours to meals, orders or calls. Shift supervisors, maintenance technicians and nonproducing trainers go to overhead. Classify each role consistently across sites, including leads who split time between supervision and production.
Where it fits in the master budget
Plan your budgets in this order: sales, production, direct materials and labor, overhead, then cash. Most budgeting sequences start with sales, because the sales forecast typically sets how much you need to produce or serve.
Build the cash budget from cash receipts and payments plus the direct labor, overhead, sales and administrative, and capital assets budgets. Missing a holiday sales peak understates labor hours, hours-based overhead and payroll cash.
Four turnover costs to build into a direct labor budget
Departures, vacancies, coverage overtime and new-hire ramp-up can push actual staffing away from your budget assumptions. The Frontline Report 2025, published in October 2025 with research by Lighthouse Research & Advisory, estimates frontline replacement costs “averaging $7k per replacement, excluding productivity loss.” It also shows that hiring costs have risen since 2020.
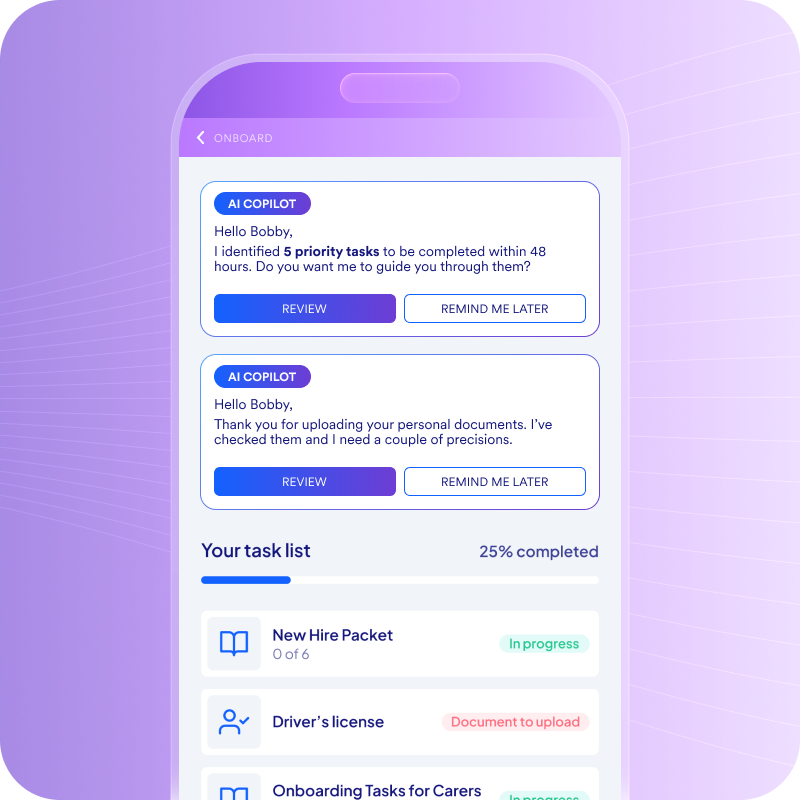
Faster ramp-up. Lower early attrition. AI onboarding built for speed, scale, and retention.
Top employers are already using Fountain’s Frontline OS to:
✅ Reduce turnover in the first 60 days
✅ Eliminate manual paperwork and task delays
✅ Accelerate new hire productivity with smarter workflows
Curious what smarter onboarding could unlock for your team?
BLS research puts the monthly quits rate in August 2026 at 3.5% in accommodation and food services and 3.0% in retail trade, against 1.9% for total nonfarm employment.
Budget for four costs after a quit:
- Replacement hiring: Sourcing, screening and onboarding outside hours-times-rate calculations.
- Time-to-fill: Uncovered hours or hours reassigned while a requisition stays open.
- Vacancy overtime: Overtime pay for existing workers covering vacancies.
- Ramp-up: Full pay while new hires produce below standard for weeks.
Add explicit lines for these hours and costs before checking variance.
How to build a direct labor budget in six steps
Six steps turn a demand forecast into budgeted hours and dollars, then split them by site and role. Each step supplies the input for the next.
1. Forecast units or demand for each period
Forecast each site’s demand by quarter, then add monthly or weekly detail for peaks. Use the unit that drives the work: covers or transactions for a quick-service restaurant (QSR), orders or lines picked in a warehouse, retail transactions, contact-center calls by interval, or billable shifts for staffing.
Peaks often make up the largest part of the budget, and they shift from year to year. The National Retail Federation’s 2026 holiday forecast expects retailers to hire between 325,000 and 375,000 seasonal workers, compared with 356,000 estimated the year before.
Avoid carrying last year’s volumes forward flat. Adjust them for this year’s sales plan, location openings or closures and promotions and reconcile peak-quarter units with the sales budget before converting them to hours.
2. Set labor hour standards per unit
A labor standard is the time a trained worker needs per unit at a sustainable pace. Set one for each role and site using one of three methods:
- Engineered time study: Time each task element, with allowances for personal, fatigue and delay time.
- Historical ratio: Divide past direct labor hours by units, such as hours per 100 covers.
- Standard costing: Assign expected hours per unit so you can track variance later.
Refresh standards each budget cycle and after process, menu, layout or system changes. SQM Group found that in 2024, participating centers’ average handle time reached 697 seconds, up 18% year over year, so a standard carried over from the year before would have understated agent hours.
3. Calculate required direct labor hours
Multiply forecast units by the standard hours per unit to get production hours for each period. Then add ramp-up hours for new hires: the training time and the weeks they typically work below standard.
You pay for their full hours while output lags, so leaving ramp-up out understates the budget, especially in peak quarters when seasonal hires arrive at once. To size it, multiply planned hires for each quarter, including turnover replacements, by training hours per hire. A fuller model also adds a productivity shortfall for the first weeks after training.
Keep ramp-up on its own line so you can see how much of the budget turnover consumes.
4. Build a fully loaded hourly rate
A loaded rate starts with the base wage and adds the overtime premium, benefits and employer payroll taxes that come with every hour worked. Benefits are a large share. In the BLS Employer Costs for Employee Compensation release for June 2026, benefits made up 23.1% of total compensation in private-industry service occupations and 31.4% in transportation and material moving.
Pull each component from your own payroll data rather than national averages, and build a separate rate for each role and site. Treat the result as a planning estimate, not tax advice, and confirm rates with your payroll provider or tax advisor. The section after these steps works through a simple build-up.
5. Multiply hours by the loaded rate
Multiply each period’s total hours, production plus ramp-up, by the loaded rate for that role to get its direct labor cost. Then add the periods together for the annual budget.
Keep the quarters visible instead of reporting one annual figure. Peak quarters usually carry both higher volume and most of the ramp-up hours, so their share of labor cost runs above their share of units. Send quarterly totals to whoever owns the cash budget, and flag peak-quarter payroll that lands before the revenue it supports. If a wage increase takes effect mid-year, apply the new rate only to the periods after it starts.
6. Split the budget by location and role
Build the budget one line per site and role, each with its own units, standard and loaded rate, then total the lines. Company-wide rates hide real differences: BLS data show private-industry compensation rose 2.3% in New England and 4.3% in the Pacific region over the year ended September 2026.
Translate each site’s hours into weekly hours and shifts, a number site leads can check against their schedules. Refresh site standards as layouts, volumes and menus change, and compare scheduled with budgeted hours every week so gaps surface before payroll closes.
Build a fully loaded labor rate, line by line
Say a frontline role pays a base wage of $20 an hour. Each layer below adds to that base, using round planning assumptions:
- Base wage: $20.00 an hour.
- Overtime premium: If 5% of hours run at time and a half, each of those hours costs an extra $10. Spread across all hours, that adds $0.50 (5% × $10).
- Benefits: Paid leave, health insurance and retirement at 25% of the base wage add $5.00.
- Employer payroll taxes: Payroll taxes and employer insurance contributions at 10% of the base wage add $2.00.
The fully loaded rate comes to $27.50 an hour, 37.5% above the posted wage. A budget priced at $20 would understate every labor hour by that gap, so swap in your own payroll percentages for each role and site.
Check actual labor spend against a flexible budget
A static budget only shows whether spend beat the original plan. A flexible budget shows what the hours should have cost at the volume you actually handled, so measure actual spend against it and split the gap into two variances. Rate variance shows whether you paid more per hour than planned; efficiency variance shows whether you used more hours than the output called for:
- Rate variance = actual hours × (actual rate − standard rate)
- Efficiency variance = standard rate × (actual hours − standard hours for actual output)
A positive result in either formula is unfavorable, meaning you spent more than the standard allowed.
Say a site budgets 10,000 orders for a month at 6 minutes (0.1 hours) each, or 1,000 hours at the $27.50 loaded rate. It actually handles 11,000 orders, works 1,200 hours, and pays $29 an hour:
| Measure | Calculation | Result |
|---|---|---|
| Static budget | 1,000 hours × $27.50 | $27,500 |
| Flexible budget at actual volume | 11,000 × 0.1 = 1,100 hours × $27.50 | $30,250 |
| Actual cost | 1,200 hours × $29 | $34,800 |
| Rate variance | 1,200 × ($29 − $27.50) | $1,800 unfavorable |
| Efficiency variance | $27.50 × (1,200 − 1,100) | $2,750 unfavorable |
| Total vs. flexible budget | $1,800 + $2,750 | $4,550 unfavorable |
Higher volume accounts for $2,750 above the static plan; higher rates and more hours per order explain the remaining $4,550. Diagnose these variances with four metrics:
- Overtime percentage: Overtime hours divided by total hours worked, by site and role, compared against the overtime allowance in the loaded rate.
- Vacancy rate: Open approved positions divided by total approved positions, measured on the same date each month.
- Time-to-fill: Calendar days from requisition opened to offer accepted. SHRM’s 2026 benchmarking reports a 39-day median for nonexecutive positions across all roles.
- Early attrition: New hires who left within 90 days divided by all hires in that cohort.
Managers covering vacancies with overtime can raise rate variance; repeated ramp-up after early departures can raise efficiency variance. Pull all four metrics when either variance exceeds your threshold for two consecutive months.
Fountain’s role in keeping frontline labor spend on plan
That variance often starts with slow fills, early quits and gap-covering overtime. Cue, Fountain’s Frontline Superintelligence, runs the agents and products that work on them.
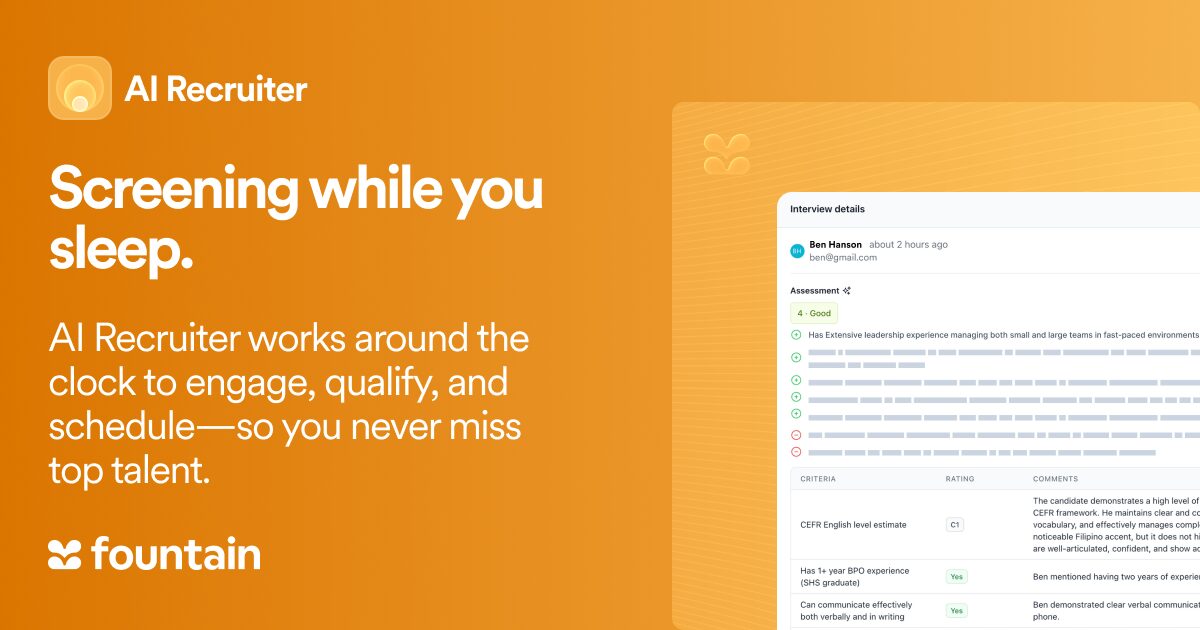
- Faster fills: Anna, the AI Recruiter, runs structured phone or browser interviews 24/7 and returns scores, transcripts and summaries for human review.
- Earlier attrition signals: Sam, AI Retention, checks in with every new hire at seven points, from before day one to exit, and finds issues before they become problems.
- Coverage before overtime: Shift & Scheduling detects open shifts and texts qualified workers before managers reach for overtime.
Marsden Services cut time-to-hire from 18 to 7 days and reduced the vacancy rate at its client’s locations from 18% to 6%, leaving fewer open positions to staff.
Fountain connects with HCM and payroll systems such as UKG, SAP, ADP and Workday. Cue asks for approval before changing records, and hiring managers make the final hiring call.
Build next quarter’s labor budget around the hours you’ll actually staff
A direct labor budget holds up when every cycle follows the same moves: forecast units, set a labor standard per unit, load the hourly rate, add ramp-up hours, and check rate and efficiency variance against a flexible budget monthly. Quits, open requisitions, vacancy overtime and slow ramp-up typically push frontline spend off plan, so track them beside the budget.
Fountain’s Frontline Superintelligence works on those drivers directly: AI interviews that speed up fills, new-hire check-ins that flag retention risk early, and shift matching that covers gaps before overtime.
Book a demo to compare one pilot location’s vacancy and overtime against its baseline.
Frequently asked questions about direct labor budgets
What are the four types of budgets?
The four budgets usually named are operating, capital, cash and financial. Operating covers revenue and expenses, capital covers major asset purchases, cash covers inflows and outflows, and financial covers assets and liabilities. Direct labor sits in the operating budget, and its payroll dollars also feed the cash budget.
How often should a frontline employer update its direct labor budget?
Among organizations in the 2025 FP&A Trends Survey, 46% forecast monthly and 40% quarterly. Re-price the next four quarters with current volumes, standards and rates, and update between cycles after location openings or closures, wage changes or peak-plan revisions.
How do seasonal and temporary workers fit into a direct labor budget?
Give seasonal and temporary workers their own rate and hours lines. Their loaded rate often differs from core staff because of benefits eligibility or an agency markup. Returning seasonal workers usually ramp up faster but still need refresher training, so budget reduced training hours rather than none.
What is the difference between a labor budget and a staffing plan?
A labor budget sets hours and dollars; a staffing plan sets headcount, positions and shifts. The staffing plan assigns people to the budgeted hours, allowing for part-time schedules and turnover. Each quarter, convert budgeted hours into positions and confirm the two totals match.