New frontline hires leave fast. Per the 2025 Fountain Frontline Report, 43% of new frontline hires leave within 90 days. Fountain estimates replacing each one costs about $7,000, which at enterprise scale runs into the tens of millions annually in rehiring and lost productivity.
Retail averages 60% annual turnover, well above the 16% benchmark SHRM reports for office-based workers. Reporting a single company-wide turnover number to the C-suite hides the floor-level problem.
This article covers the employee turnover formula, a worked example with frontline numbers, how to segment the result so it’s actually useful, and what “good” looks like across industries.
What is employee turnover rate?
Employee turnover rate is the percentage of employees who leave your organization over a defined period, measured against your average headcount. It’s the single most common metric for quantifying workforce stability, and for frontline hiring, it’s the number that connects staffing gaps to revenue loss.
Three terms get tangled in turnover conversations:
- Turnover captures everyone who left, for any reason
- Attrition is often used interchangeably with turnover, though some organizations reserve it for voluntary departures only
- Retention is the inverse: the percentage of employees who stayed
When someone says “we have 70% retention,” they mean 30% turnover. It’s worth confirming which definition your organization uses before comparing numbers across departments or benchmarking against industry data.
Frontline turnover numbers look different from corporate ones for structural reasons. Seasonal hiring surges, shift-level dynamics, multiple locations with different managers, and a labor market where candidates take the first offer that moves fast enough can all push the numbers around.
A corporate HR team tracking turnover near typical office-level benchmarks and a warehouse operations team tracking much higher churn are dealing with fundamentally different workforce dynamics. The formula is the same, but the context around it changes everything.
The employee turnover rate formula
Turnover Rate = (Number of Separations in Period ÷ Average Headcount) × 100
This formula is consistent across SHRM, CIPD benchmarking, and every major professional body that publishes workforce analytics guidance.
Defining leavers
“Leavers” means everyone who separated from your organization during the period: voluntary quits, involuntary terminations, retirements, and end-of-contract departures. You can track them together for an overall rate, but separating voluntary from involuntary turnover is where the diagnostic value lives.
Voluntary turnover tells you about retention problems, while involuntary turnover tells you about hiring quality and performance management. For frontline operations, voluntary-only turnover is usually the more actionable number because it reflects problems you can fix: scheduling, onboarding, management, and pay competitiveness.
Defining average headcount
Average Headcount = (Starting Headcount + Ending Headcount) ÷ 2
This smooths out the fluctuation between the beginning and end of your measurement window. In a frontline environment where you might start a quarter with 200 people and end with 160, the difference between using starting headcount alone and average headcount changes your turnover rate by several percentage points.
Choosing your time period
The three common measurement windows are monthly, quarterly, and annual. Monthly is the most useful cadence for frontline teams because it catches problems inside a season, not after it.
If your night shift at a specific warehouse starts losing people in March, a monthly calculation surfaces that by early April. However, an annual calculation can bury it in a year-end average.
Quarterly works for executive reporting, but annual works for board presentations and industry benchmarking.
How to calculate your frontline employee turnover rate: a worked example
Warehouse example (quarterly)
Step 1: Pick a period. We’ll use Q2 (April through June).
Step 2: Gather headcount. A 200-person warehouse starts Q2 with 200 employees and ends with 180.
Step 3: Count separations. During Q2, 48 employees left (38 voluntary quits, 10 terminations).
Step 4: Compute average headcount. (200 + 180) ÷ 2 = 190.
Step 5: Apply the formula. (48 ÷ 190) × 100 = 25.3% quarterly turnover.
Annualized linearly (25.3% × 4), that’s north of 100%, meaning the warehouse is replacing its entire workforce over the course of a year. As seen in Fountain’s Redefining Frontline Operations research, replacement costs run $6,500 to $7,000 per frontline employee, or roughly 40% of annual pay.
Those 48 quarterly departures represent $312,000 to $336,000 in replacement costs for a single location in a single quarter.
Retail store example (monthly)
Step 1: Pick a period. We’ll use June.
Step 2: Gather headcount. A 50-person store starts June with 50 employees and ends with 44.
Step 3: Count separations. During June, 9 employees left.
Step 4: Compute average headcount. (50 + 44) ÷ 2 = 47.
Step 5: Apply the formula. (9 ÷ 47) × 100 = 19.1% monthly turnover.
Annualized linearly (19.1% × 12), that’s 229%. At a 50-person store, that arithmetic implies turnover at more than twice the number of roles in the store over the course of a year.
Why frontline turnover rates need their own lens
SHRM’s deskless worker benchmark sits at 26%, but that figure blends low-churn deskless roles with high-churn ones.
Across retail, food service, and warehousing, where most frontline hiring concentrates, turnover runs substantially higher than in office-based roles. Accommodation and food services recorded the highest BLS quit rate of any sector tracked by BLS at 3.9% monthly as of early 2026. In some parts of the restaurant sector, restaurant turnover can exceed 100% annually, as reported by Deloitte.
Frontline turnover is also more volatile. Weather, local competition, and seasonal ramps can all disrupt attendance and retention in ways a corporate accounting department usually doesn’t face.
When a company with 80% frontline and 20% corporate employees reports a blended turnover number, that number tells the board almost nothing. The corporate side could be running at 16% while the frontline side churns much faster. A blended figure can mask a frontline crisis and obscure the budget needed to fix it.
How to break down your turnover rate by location, role, and shift
A single frontline turnover number still masks the variance that matters. One retail group might see manageable turnover at one store and crisis-level churn at another in the same month.
Three dimensions reveal the real problems.
- Location: Turnover calculated per store, warehouse, or region surfaces the outliers. Fountain’s Agentic AI for Frontline Workforces research documents 3x variance in turnover across locations within the same company. The goal is to find the three locations that are dragging the average up, not to defend the average.
- Role: Cashier turnover and shift lead turnover are different problems with different fixes. In retail, hourly store roles tend to turn over much faster than store management roles. The roles with the highest churn deserve the closest monthly attention.
- Shift: Night and weekend shifts behave differently than days. The people working them often have childcare, second jobs, or commute constraints that make small schedule changes costly, which shows up as higher churn when the schedule gets sloppy. If your company average looks fine but your third-shift numbers are twice that, you’re not running a company-wide problem. You’re running a shift problem.
Stack these three cuts and you get a map: location tells you where, role tells you who, shift tells you when. A site with 60% turnover might actually be a cashier problem on nights, not a store-wide problem.
Start by pulling the last 90 days of separations and cutting them all three ways. The smallest intersection that still shows elevated churn is where the intervention goes.
How Fountain helps you track and reduce frontline turnover
Spreadsheet-based turnover tracking runs behind reality. By the time the data is pulled, cleaned, and calculated, the month is over, and the people are gone. Closing the gap between a separation and a manager knowing about it is what separates teams that react from teams that prevent.
Cue, Fountain’s Copilot, sits inside every Fountain product and pulls turnover data by location, role, and shift in plain language. A regional manager can type “pull Q2 turnover by shift across all Southeast stores and flag any location above 30 percent” and get the answer back without opening an analytics dashboard.
The same prompt pattern works for 90-day retention, time-to-productivity, and any other metric the platform tracks. Cue orchestrates across Fountain’s ATS, Onboarding, Shift & Scheduling, and CRM, along with the HCM integrations Fountain feeds into (UKG, SAP, ADP, Workday).
The view is connected, not stitched together. That’s what Fountain means by Frontline Superintelligence for the global frontline workforce.
Tracking the number is only half the work. Reducing it means eliminating onboarding friction before the first shift: documents, I-9 verification, E-Verify, and scheduling details.
Fountain Onboarding handles this end-to-end. GoFor, a last-mile delivery company, cut applicant attrition by 62% and reduced onboarding time by 83 percent, dropping from 30 days to 5 days after consolidating their fragmented process into a single workflow.
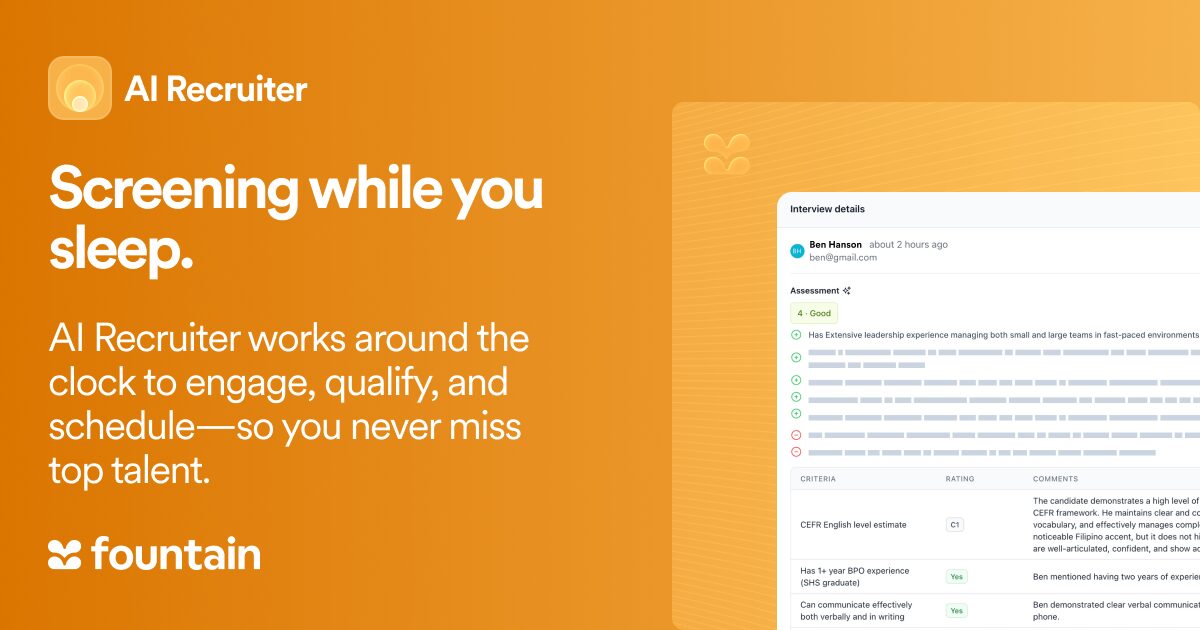
Additionally, speed-to-hire matters because frontline candidates take the first offer that moves fast enough. Anna, Fountain’s AI Recruiter, conducts candidate phone interviews 24/7, and Fountain’s CRM re-engages past applicants so teams aren’t hiring cold every time someone leaves.
The turnover rate formula is straightforward, but the value comes from segmenting it by location, role, and shift, pairing it with 90-day retention and time-to-productivity, and acting on what the data reveals rather than reporting a blended number that obscures the problem.
Every unfilled shift has a dollar amount attached to it. The teams that move the number are the ones who can see it in real time and act on it in the same week.
Book a demo to see how Fountain connects turnover data to the hiring and onboarding fixes that move the needle.
Frequently asked questions about employee turnover rate
What is a good employee turnover rate?
It depends on industry and role type. Retail frontline often falls around 40 to 60% annually; manufacturing hiring typically runs lower.
Some retailers are often cited for strong employee retention, suggesting the floor may be lower than the average in certain cases. The most useful comparison is against sector peers, tracked quarter over quarter.
How do you calculate monthly turnover vs. annual turnover?
Use the same formula for both: (leavers in period ÷ average headcount) × 100. For monthly, count separations and headcount for one month. To annualize a monthly rate, multiply by 12 for a linear estimate.
In high-volume hiring, be aware that a compound method (1 minus the quantity 1 minus the monthly rate, raised to the 12th power) produces a more accurate annualized figure because it accounts for continuous workforce reduction.
What’s the difference between turnover rate and attrition rate?
Many organizations use them interchangeably, but when a distinction exists, turnover typically covers all separations (voluntary and involuntary) while attrition refers specifically to voluntary departures.