Direct recruiting spend for a frontline role lands in the low-thousands and sits toward the lower half of SHRM’s benchmarking distribution. That number is a trap. Once vacancy coverage, turnover churn, and ramp-up loss are layered in, the true annualized cost per seat can exceed direct recruiting cost by a wide margin and run materially higher in retail and restaurant settings.
SHRM’s 2025 nonexecutive average of $5,475 captures one moment in time for one hire. Frontline math diverges from that anchor because of volume, churn, and shift-coverage costs that white-collar hiring never carries, and because hiring costs across frontline sectors have doubled since 2020 according to the 2025 Fountain Frontline Report.
This article covers a 5-bucket cost formula, a worked example for a logistics operation, and a map of every cost driver to the operational lever that compresses it. Teams running a real high-volume hiring strategy need that map to make the math work.
What is the cost to hire a frontline worker?
Cost per hire is the number teams track. Cost per seat per year is the one that matters. The first measures the one-time price of filling a seat. The second measures the annualized cost of keeping that seat staffed across one full turnover cycle, including the rehire that will almost certainly come within 12 months.
Cost-to-hire for a frontline worker is the total of recruiting spend plus the surrounding costs that the recruiting line item doesn’t capture. The headline recruiting number accounts for job boards, screening, interviews, background checks, and recruiter labor. The annualized cost per seat per year accounts for all of that, multiplied by turnover frequency, plus the vacancy cost of every day the role sits empty.
Replacement costs for a frontline worker run between $6,500 and $7,000, or roughly 40% of annual pay, per Fountain’s Redefining Frontline Operations research. Most frontline teams focus on the line item they can see, and lose money on the 4 they can’t.
The full cost formula: 5 buckets most teams miss
Teams that count only recruiting spend underestimate the real number because total hiring costs sit across 5 buckets, not 1. Most finance reviews capture only the third.
1. Separation costs
Final pay, unused PTO, exit administration, knowledge transfer, and severance or stay-pay exposure all hit the P&L before the replacement search even starts. The cost begins the moment someone gives notice.
2. Vacancy costs
Overtime for existing staff runs at 1.5x the regular rate per the Fair Labor Standards Act (FLSA), contractor coverage piles on markups over base wage, service levels slip while seats sit open, and revenue drops on every unstaffed shift. Every day the seat is empty, the meter is running.
3. Recruiting costs
Job boards, sourcing fees, screening time, interview hours, background and drug checks, and recruiter labor all roll into this bucket. It is the only bucket most spreadsheets actually track.
4. Onboarding costs
I-9 processing, training, equipment, manager hours, and compliance documentation all run through onboarding. These costs rise when onboarding is compressed into a day or two, which 25% of employers still do per Redefining Frontline Operations.
5. Productivity loss
The ramp window is the period when a new hire earns full wages but produces below standard output. In frontline roles this window is shorter than for corporate hires, but it compounds across volume.

The recruiting bucket is usually only part of the total. The rest sits in the 4 buckets most teams don’t quantify, and that gap is where the cost per seat per year hides.
The vacancy problem: What does an unfilled shift actually cost?
Vacancy is the bucket most often missing from the spreadsheet. Monthly vacancy costs for a single unfilled frontline role pile up once overtime, coverage premiums, lost productivity, and recruiting costs accumulate across the search cycle. Cost-per-hire measures the price of filling the seat; vacancy cost measures the price of the seat being empty. Both compound.
Marsden Services, a facility services provider operating across 50-plus brands, cut one client’s location vacancy rate from 18% to 6% (a 66% reduction) after consolidating hiring on Fountain. Vacancy rate is the operational metric that translates cost-per-hire improvements into revenue protection.
If your spreadsheet has a CPH number and no vacancy line, the spreadsheet isn’t complete.
Why turnover makes every hire more expensive
Turnover converts cost-per-hire from a one-time line item into a recurring annualized cost. Each departure restarts the replacement cycle and adds new separation, vacancy, onboarding, and ramp-up costs on top of the recruiting spend.
Frontline turnover runs at 45% overall, with retail clearing 60% and logistics and healthcare both at 38%, according to Fountain’s Agentic AI for Frontline Workforces research.
For a workforce of 10,000 running at those rates, the 2025 Fountain Frontline Report puts the annualized turnover cost at $40 million per year, with $18 million coming from new hires who leave inside 90 days. Within that first 90-day window, 43% of new hires leave. The recruiting investment is spent before the worker produces meaningful output.
The metric that matters is cost per seat per year, not cost per hire.
Cost profiles by frontline industry
Cost-per-hire isn’t a single number across frontline categories. The spread is driven by 3 variables: wage level, annual turnover rate, and time-to-fill. The 4 verticals Fountain works in most closely each carry a different cost profile.
- Retail: Annual turnover runs at 60% per Agentic AI for Frontline Workforces. Replacement costs land at the high end of the 40%-of-pay rule, and seasonal spikes drive vacancy exposure up further.
- Logistics and delivery: Annual turnover sits at 38%, and driver-shortage premiums add to vacancy cost per unfilled shift. Annualized cost per seat can run meaningfully above direct recruiting cost depending on route density.
- Quick-service restaurants (QSR): Turnover often clears 60%, and time-to-fill pressure compresses every other cost bucket. The first offer almost always wins the candidate.
- Healthcare: Turnover runs at 38%, and credentialing and compliance overhead lift the recruiting bucket, particularly for roles such as nursing assistants.
- Outsourced services and business process outsourcing (BPO): Multi-client, multi-location coordination layers additional cost on top of the standard formula.
The industry your business operates in sets the floor on cost per seat. Operational choices set the ceiling.
How to calculate your true cost to hire
The standard cost per hire formula applies here:
Cost per hire = (Internal costs + External costs) / Number of hires
Then add the 2 buckets most spreadsheets miss:
Cost per seat per year = Cost per hire + (Annual turnover rate x Cost per hire) + Annual vacancy cost per seat
To illustrate, let’s say a logistics company hires 500 driver roles per year at $19 per hour, with 38% annual turnover and a 21-day average time-to-fill. Recruiting CPH lands at $2,100 per hire after job boards, screening, recruiter labor, and interviews.
At 38% turnover, the 190 replacement hires add another $399,000 in recruiting cost on top of the 500-hire baseline. Those 190 vacancies, at 21 days each and roughly $190 per day in overtime and coverage, create $758,100 in vacancy exposure.
The total annual cost for 500 seats:
(500 x $2,100) + $399,000 + $758,100 = $2,207,100, or $4,414 per seat per year.
That is more than double the $2,100 recruiting CPH alone, and the gap widens as turnover climbs. The levers that compress these costs all trace back to automated hiring workflows running through a unified Applicant Tracking System (ATS).
How technology cuts the cost-to-hire stack
Every cost bucket in the formula maps to a specific operational lever, and the right technology compresses 3 buckets at once. The 5 mechanisms below each tie to a Fountain product or capability category in the section that follows.
- Mobile-first application protects top-of-funnel spend: 60% of applicants abandon long or desktop-only applications per Redefining Frontline Operations. A mobile-first application surface keeps recruiter spend tied to applicants who actually finish.
- Agentic screening compresses time-to-hire: Agentic AI for Frontline Workforces shows manual-to-agentic shifts of 14-plus days down to 6 to 8 days. Voice and SMS first-round interviews running 24/7 replace the wait for a recruiter calendar slot, and every day removed is vacancy cost recovered.
- Automated candidate communication closes the ghosting gap: 52% of frontline candidates cite ghosting as their top frustration per the 2025 Fountain Frontline Report. A 24/7 conversational layer across SMS, voice, and chat handles candidate questions at every funnel stage, lowering the cost-per-qualified-candidate ratio.
- Built-in compliance prevents fine exposure: Immigration and Customs Enforcement (ICE) audits topped 6,400 in a single fiscal year per Fountain’s Employer’s Guide to I-9 Audits, with paperwork fines running up to $2,861 per violation and repeat unauthorized-worker penalties reaching $28,619 per worker. Centralized I-9 tracking inside the onboarding workflow moves compliance from line item to invisible.
- Cross-location orchestration shrinks the coordination tax: 70% of HR teams use 3 to 6 apps for a single task per Redefining Frontline Operations. A single orchestration layer eliminates duplicate workflows across sites and gives operations leaders a unified view across brands and locations.
Whether these capabilities compress costs depends on running inside a single system or scattering across disconnected tools. AI for hourly hiring pays back when the screening, communication, and orchestration layers run together.
How Fountain runs frontline hiring at lower cost per seat
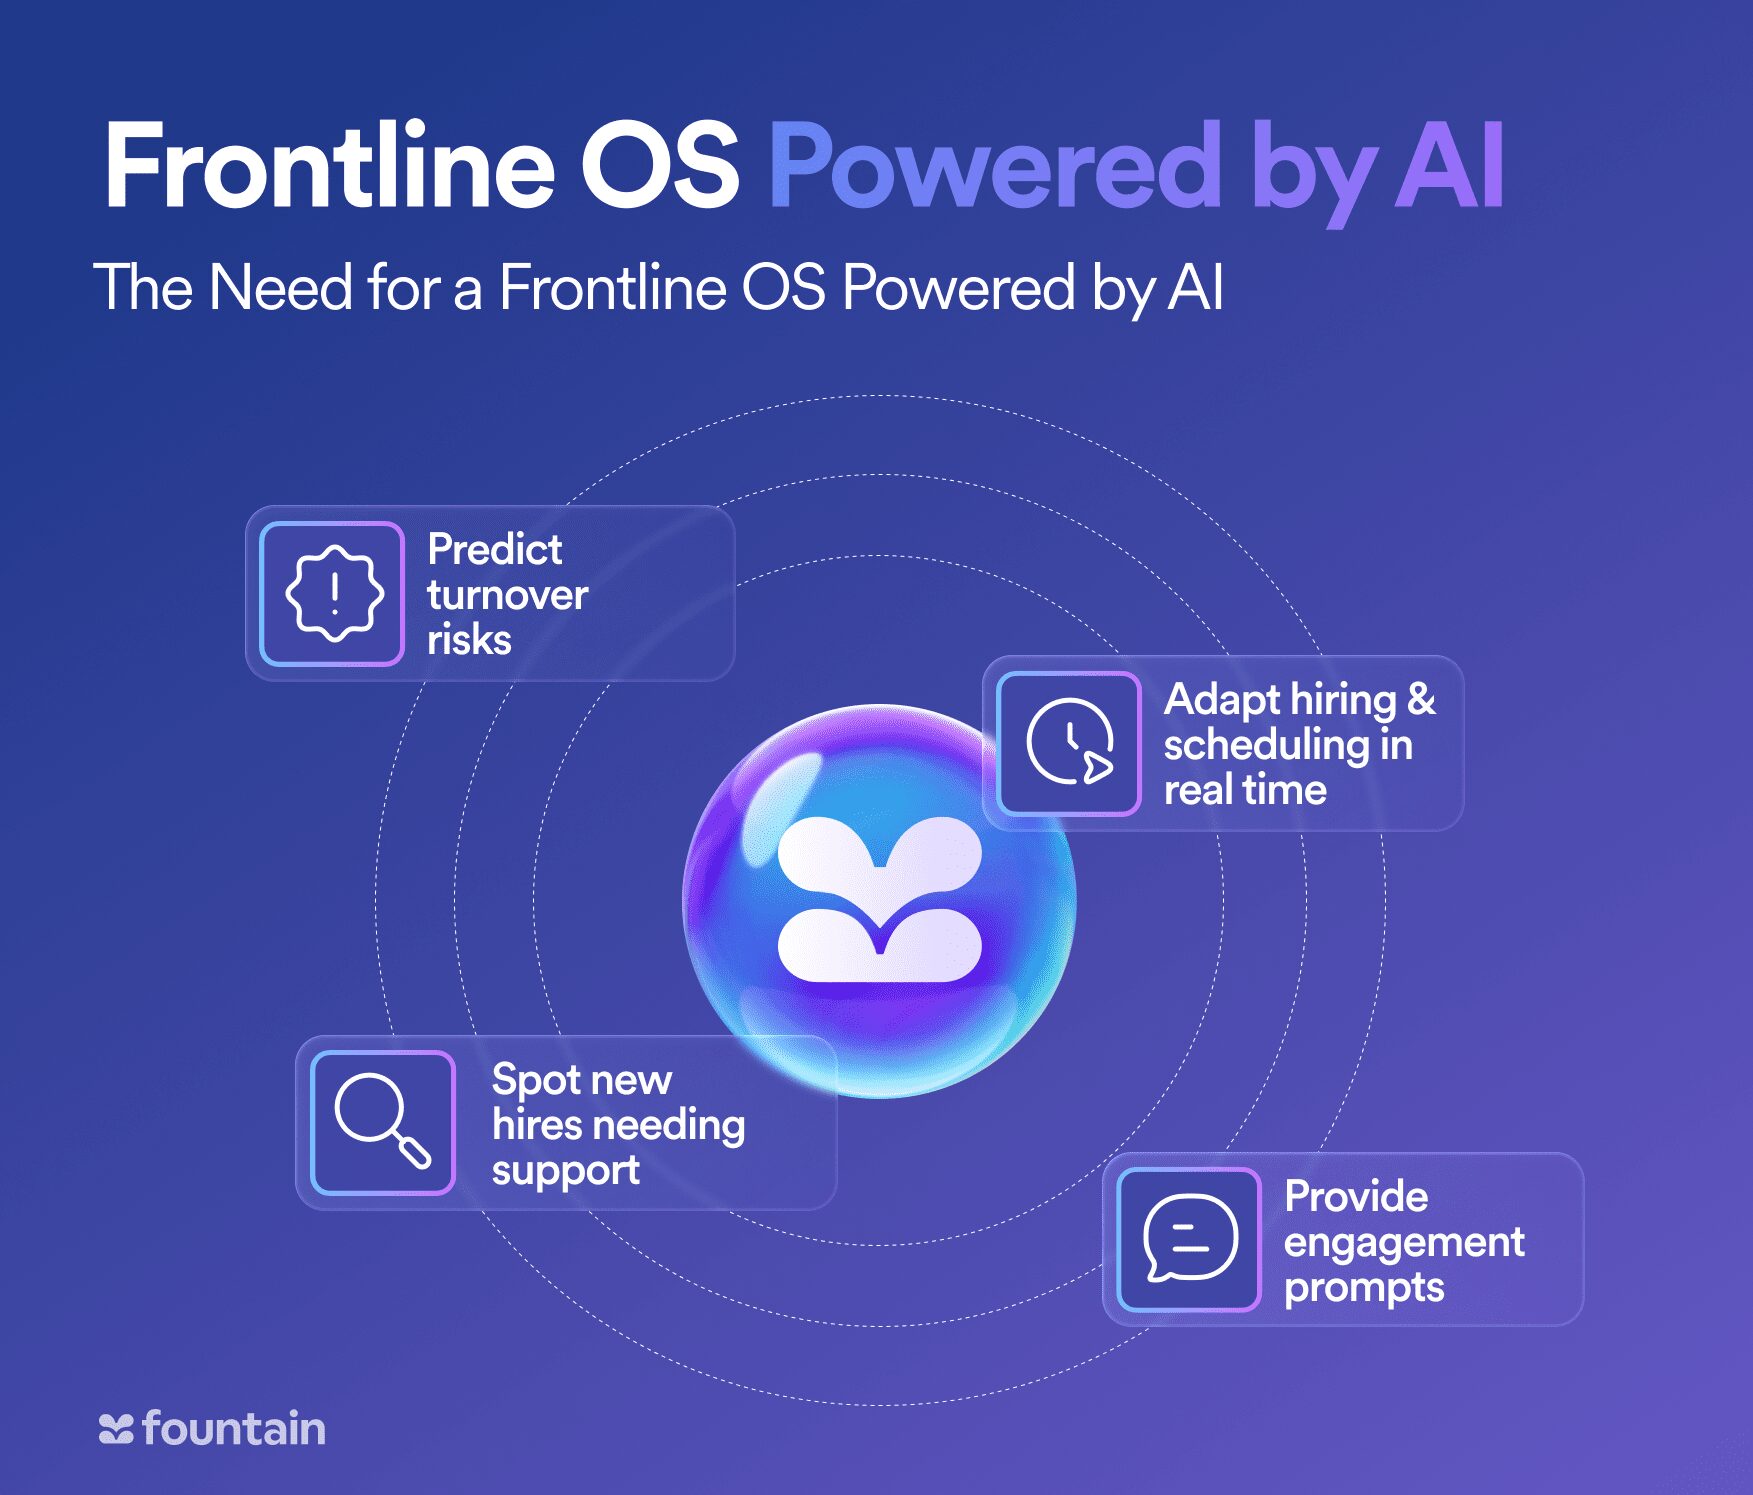
Fountain compresses cost per seat by closing the gap between knowing the cost is high and doing something about it. Cue is the orchestration layer, the single entry point to every agent on the Fountain platform. Cue translates a plain-English goal like “Hire 200 drivers across 5 cities before peak season” into orchestrated tasks across hiring, onboarding, and shift coverage, compressing the coordination tax that inflates every cost bucket.
Under Cue, 3 named agents run the work:
- Anna conducts AI voice and SMS interviews around the clock, compressing the recruiting and vacancy buckets by replacing the wait for a calendar slot.
- Emma provides 24/7 candidate support across SMS, chat, and voice, attacking the drop-off that inflates cost-per-qualified-applicant.
- Sam runs post-hire satisfaction checks that catch early-attrition signals inside the first 90 days, the window where Fountain’s research puts $18 million of the $40-million-per-year turnover tax for a 10,000-worker employer.
The agents sit on top of Fountain’s purpose-built frontline platform: ATS, CRM, Onboarding, Shift & Scheduling, and Sourcing. The outcomes show up in the cost-per-hire ledger. Alto ran at $300 per hire against the $4,700 SHRM industry average while expanding into 5 new markets with 3 recruiters. For example, Fetch moved from 15 days to 6.5 hours after deploying Fountain AI and Centerfield cut manual recruiter actions by 80% at the top of the funnel.
See it on a live workflow. Book a demo to walk through Cue running a hiring goal, Anna conducting first-round interviews, and the cost-per-seat math compressing in real time.
Frequently asked questions about frontline hiring costs
What is the average cost per hire for a frontline worker?
Direct recruiting cost-per-hire for frontline roles lands in the low-thousands and toward the lower end of SHRM’s nonexecutive cost-per-hire distribution. The fully loaded replacement cost runs between $6,500 and $7,000 per frontline employee, or roughly 40% of annual pay, per Fountain’s Redefining Frontline Operations research.
What is the difference between cost per hire and cost per seat?
Cost per hire measures the one-time price of filling a role. Cost per seat per year measures the annualized cost of keeping that role staffed, including turnover-driven rehiring and vacancy costs across a full cycle. For frontline roles with elevated turnover, cost per seat can run well above the single cost-per-hire figure.
How much does frontline worker turnover cost per year?
For a 10,000-worker frontline operation, Fountain’s 2025 Frontline Report puts the annualized turnover cost at $40 million per year, with $18 million of that coming from new hires who leave inside 90 days. Early attrition forces repeated replacement hiring and new vacancy exposure on top of the wasted recruiting spend.