A recruitment funnel is the structured path a candidate travels from first hearing about a role to showing up for their first shift and staying. It maps how a large pool of potential applicants narrows, stage by stage, down to the people who actually start work, measuring each step: posting, screening, interviewing, and hiring. The data shows where candidates advance and where they fall out.
Frontline employers feel each funnel leak quickly, because a missed candidate becomes an unfilled shift, overtime, or another requisition. They hire large hourly teams fast, often from candidates who apply on phones.
Candidate ghosting and employer competition can leave roles vacant before a slow process finishes, so every leak can show up as an unfilled shift or a rehiring bill. A recruitment funnel built for the frontline runs from sourcing through 90-day retention, and each stage has one metric that exposes candidate loss.
What is a recruitment funnel?
A recruitment funnel is a quantitative model of how candidates convert from a large top-of-funnel pool into hired, working employees, with each stage filtering the group down. SHRM’s recruitment definition centers on attracting qualified people in sufficient numbers and on time to apply for open roles.
The funnel adds structure to that by visualizing how candidates move through distinct stages, from sourcing at the top to offer, onboarding, and retention at the bottom.
The funnel is a scorecard for the hiring process, and it differs from the hiring process itself: the process is the task list, while the funnel is the measurement framework laid over it. A stage-by-stage view lets HR teams adjust the system one step at a time rather than overhauling a process that is already 90% effective.
That matters more in frontline hiring than almost anywhere else, because volume, speed, mobile applications, and thin margins turn a small conversion gap into a large staffing gap.
Why the standard funnel model doesn’t fit frontline hiring
The standard funnel does not fit frontline hiring because it assumes resumes, multiple interview rounds, and weeks of deliberation instead of the shorter, mobile-heavy window frontline candidates actually use. Job seekers often apply to multiple openings in a short window, and a frontline candidate may not wait for one employer’s process to finish before moving on.
The mobile share alone reshapes the model. Mobile applications surpassed desktop in 2020, with frontline and gig sectors among the highest mobile-use categories. Frontline candidates can move quickly when another option appears, so a slow process loses applicants who were ready to start.
The frontline funnel therefore has to move faster, run mobile-first, and be measured at different checkpoints than a corporate pipeline. A model built for weeks of deliberation misses the reality that your candidate may have already accepted somewhere else while you were scheduling the second interview.
The frontline recruitment funnel stages (and the one metric that matters at each)
The frontline funnel runs across seven stages, and each one has a single KPI worth watching above the rest. One metric per stage keeps the scorecard clean and usable, so the data actually gets read and acted on.
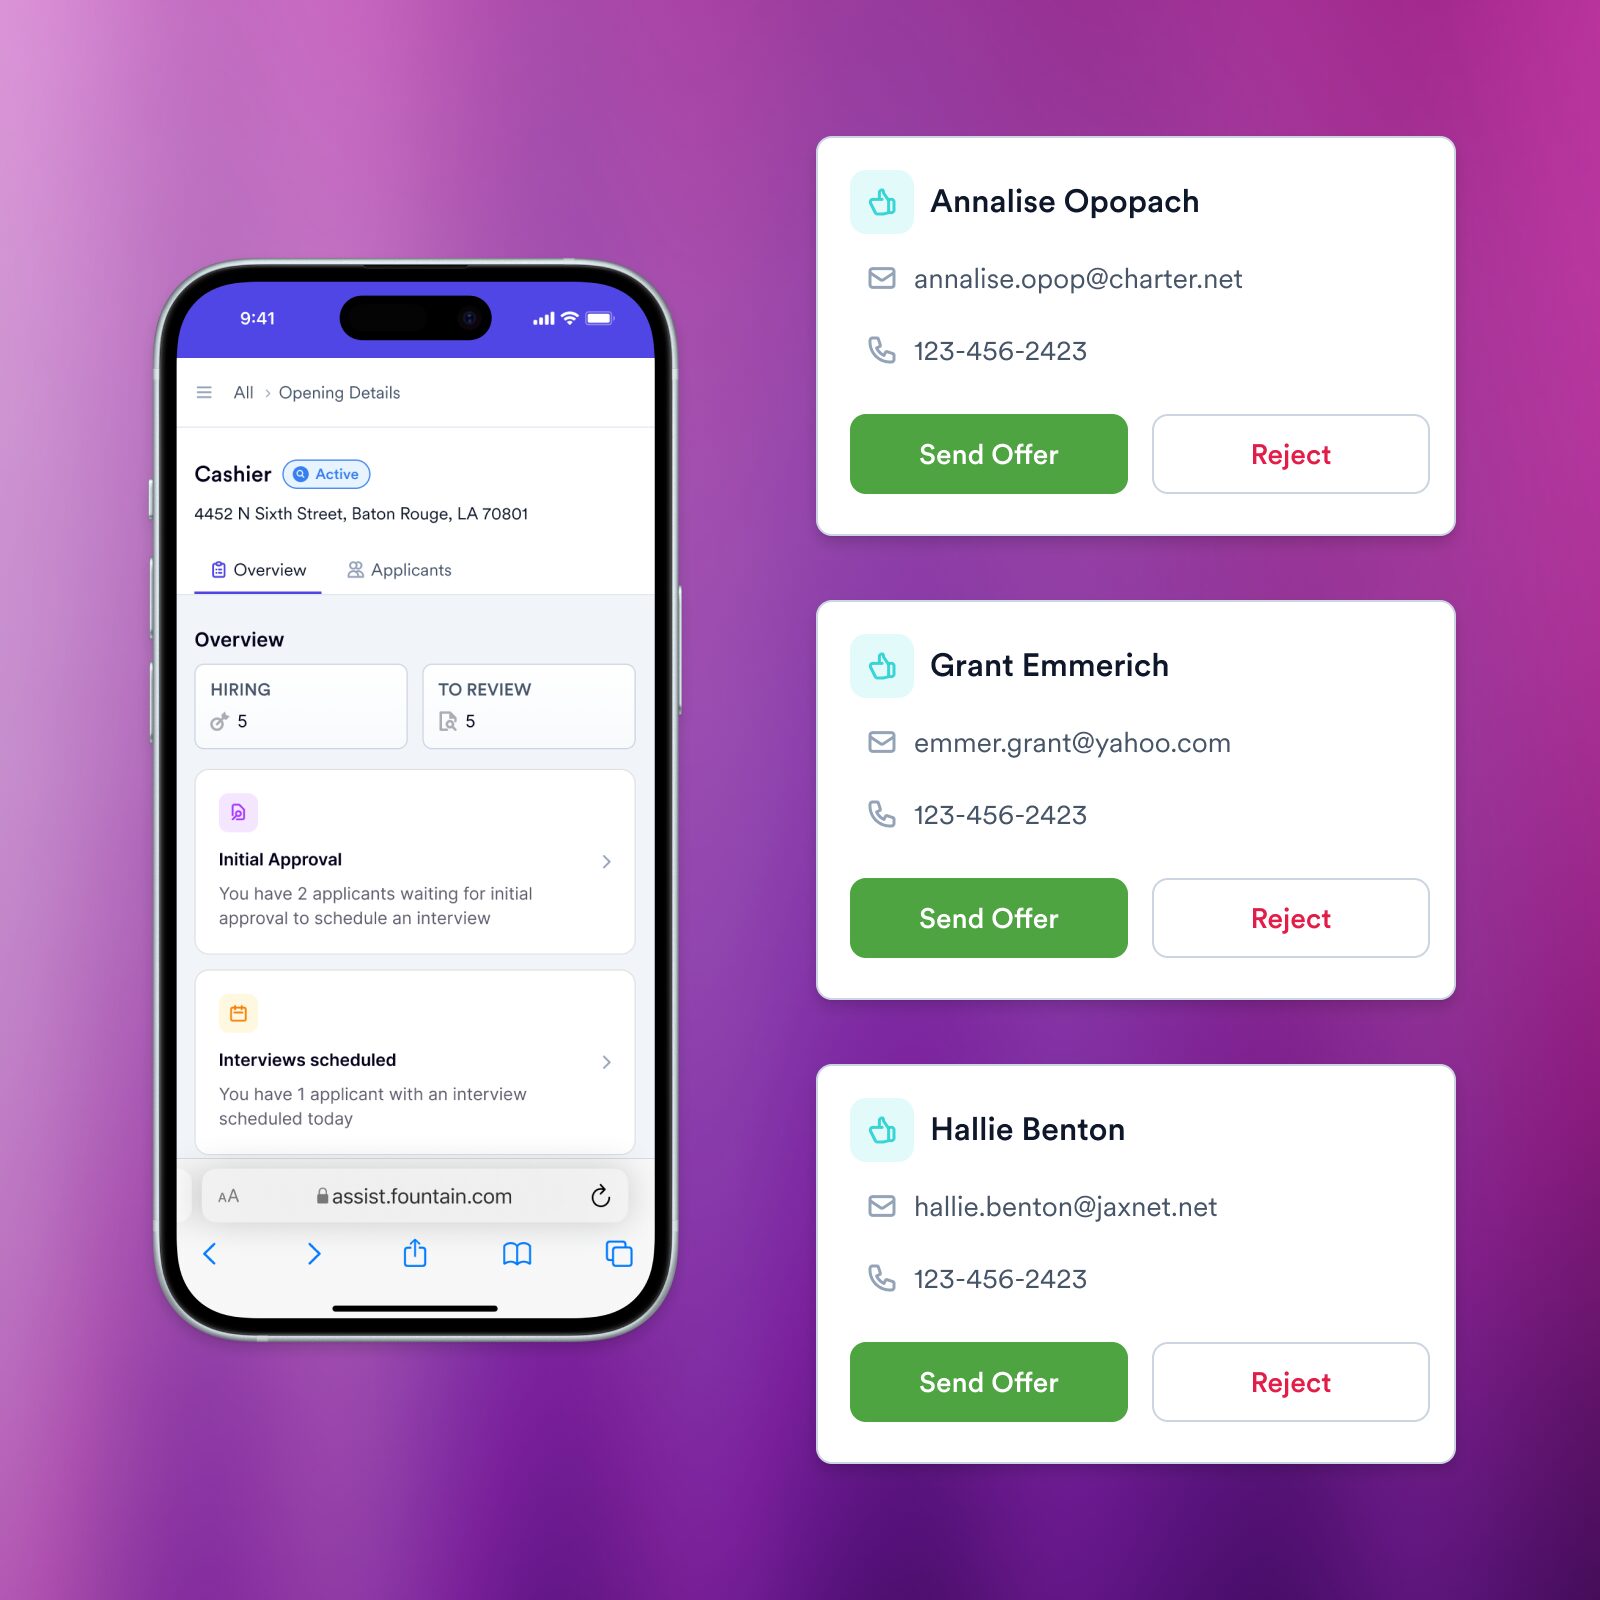
Your simple, smart, and speedy hiring solution.
Fountain knows hiring. We leverage our best in class AI to find and bring you top-tier, ready-to-work talent. We use our expertise to build personalized plans tailored specifically to your needs.
- Awareness and sourcing: Sourcing yield, the number of applicants per open role by channel, shows whether your postings generate real pipeline or just volume that never converts. Job boards and employee referrals play different roles, one filling the top of the funnel while the other surfaces better-fit applicants.
- Application: Application completion rate is the number to watch, because length and mobile friction break this stage. Removing unnecessary fields and account-creation steps gives candidates fewer reasons to abandon a form on their phone.
- Screening: Qualified candidate rate tells you how many applicants clear the bar. Too low and sourcing is bringing volume without fit; too high and your screen is probably too loose for the role.
- Interview: Interview show rate is where a major leak usually appears, since ghosting and competing offers make their pressure visible at exactly this stage.
- Offer: Offer acceptance rate can run lower on the frontline than in corporate hiring, because candidates compare wage, schedule, commute, and Day 1 in real time. A slow or vague offer, or a wage that trails the market, drags it down.
- Onboarding through Day 1: Day 1 show rate captures the share of accepted offers that turn into people showing up for a first shift. It is easy to miss when teams stop measuring at offer acceptance, yet some accepted offers never become first-shift starts.
- Retention (first 90 days): The 90-day retention rate ties recruiting to operations, and it is where a rushed hire surfaces as a cost. A large share of frontline attrition lands inside this window, which is why it belongs on the same scorecard as sourcing and screening.
Benchmarks vary by source and sector, so use these metrics to compare locations and track month-over-month movement rather than chasing a single universal number. To start, pull stage counts by role and location, then fix the lowest-converting stage first.
Where frontline funnels leak
Frontline funnels usually leak at application abandonment, offer-to-start, or early retention, and each drop-off point has a distinct cause.
- The first is application abandonment driven by length and mobile friction. Abandonment rises when forms are too long, hard to complete on a phone, or require extra steps that do not help the hiring decision, and in a mobile-heavy funnel that makes the problem especially costly for frontline roles.
- The second is candidate ghosting between offer and first shift. Speed and silence both feed it, especially when candidates keep hearing from other employers after accepting your offer, so a quiet week between acceptance and Day 1 is often where the candidate slips away.
- The third is first-90-day attrition, a lagging signal of an upstream problem. Early attrition usually points to expectation mismatch or a rushed hire, which means the fix lives further up the funnel, in how candidates were screened and set up, not in the exit itself.
To start, rank application abandonment, offer-to-start, and 90-day attrition by location, then fix the worst one first with shorter applications, faster reminders, or better Day 1 readiness.
Connecting funnel metrics to business outcomes
Every funnel leak converts into an operational cost, so reading each metric next to its dollar figure tells you where the money is going.
Application abandonment pushes cost-per-hire up, because you pay to source enough volume to overcome it. The nonexecutive cost-per-hire average is $5,475, which makes wasted applicant flow expensive even before you count manager time or lost productivity.
A low Day 1 show rate leaves shifts unfilled and drives overtime or manager scramble. The gap between accepted offers and people who actually start is where those unplanned labor costs pile up.
First-90-day attrition carries the heaviest replacement bill: replacing a frontline hire can run into the thousands once you count recruiting, onboarding, and lost productivity. In quick-service restaurants (QSR), early tenure matters because once workers get beyond 90 days, turnover drops. To start, connect each funnel drop-off to cost-per-hire, overtime, and replacement cost, so a 10-point Day 1 show-rate drop reads as uncovered shifts and overtime dollars rather than an abstract recruiting metric.
How agentic automation changes frontline funnel performance
Agentic automation raises conversion when it cuts wait time and manual handoffs, while recruiters still make the decisions that require judgment. Agentic screening qualifies candidates through 24/7 voice interviews, self-scheduling moves candidates into interview slots without recruiter back-and-forth, and demand forecasting flags where hiring needs to ramp before a gap opens.
Recruiters and managers keep offer decisions and exceptions, with human oversight where it matters.
These capabilities affect the application, screening, and scheduling stages first. Conversational application flows can raise completion when they cut application time: after a conversational redesign, Compass Group reached 85% completion after cutting application time from more than 9 minutes to under 3.
Agentic voice screening compresses slower evaluation work, and self-scheduling addresses a stage where candidate drop-off runs high, so faster scheduling, reminders, and always-on communication help qualified candidates move before another employer does.
To start, turn on one automation for your slowest manual handoff, such as screening or interview scheduling, so qualified candidates reach an interview before they accept somewhere else.
How Fountain powers the frontline recruitment funnel
When sourcing, screening, scheduling, and onboarding data sit in separate tools, recruiters cannot see exactly where candidates leave. Fountain runs the frontline funnel from one orchestration layer called Cue, which lives inside every Fountain product and gives you one place to see and act on the whole pipeline instead of stitching together a job board, a screening tool, a scheduler, and an onboarding system that do not talk to each other.
A recruiting leader can type a prompt like “Show me where drop-off is worst across all locations this month” and get the location-level view that company-wide aggregates hide.
Cue coordinates the agents mapped to each stage of the funnel:
- Anna runs voice screening and interviews 24/7, so the interview stage stops being your biggest leak.
- Emma answers candidate questions and handles onboarding paperwork like I-9 and W-4 so accepted offers turn into Day 1 starts.
- Sam tracks post-hire sentiment to surface retention risk inside the 90-day window. Recruiters and managers still approve offers and handle the exceptions that need judgment.
Fountain is Frontline Superintelligence for the frontline workforce, purpose-built for high-volume hourly hiring rather than a corporate applicant tracking system retrofitted for it. Many corporate systems were designed for lower-volume recruiting and candidates who expect a multi-week process, and that model breaks when you fill 500 roles across 200 locations and candidates take a faster viable offer.
The difference shows up in outcomes: Stitch Fix raised the share of applicants who pass background checks and show up on day one from 68% to 95%, and Bojangles cut time-to-hire from 30 days to 5.8 across 750 locations, shrinking the vacancy window before candidates could accept another job.
Every stage in this article maps to a place a candidate can quietly disappear, and the funnel only pays off when you can find that leak and close it before a shift goes uncovered. If your team is ready to see where drop-off is worst and act on it in one place, book a demo to watch Cue trace a leak across screening, scheduling, and onboarding, with Anna, Emma, and Sam working the stages where candidates fall out. Find the leak. Fix the shift.
Frequently asked questions about recruitment funnels
What is a recruitment funnel?
A recruitment funnel measures how candidates convert from a large applicant pool into hired, working employees, filtering down at each stage. Unlike a simple hiring checklist, it quantifies conversion between steps so employers can see the exact stage where candidates fall out and fix that stage specifically.
What metrics matter most for frontline employers?
The metrics that matter most are sourcing yield by channel, application completion rate, qualified candidate rate, interview show rate, offer acceptance rate, Day 1 show rate, and 90-day retention. Day 1 show rate is easy to miss, since many employers measure offer acceptance but never check how many accepted candidates appear for a first shift.
What is a good offer acceptance rate or Day 1 show rate?
A good offer acceptance rate or Day 1 show rate depends on sector, wage competitiveness, schedule fit, time-to-hire, and location-level baselines rather than one universal benchmark. For context, formal offer acceptance was 83.9% in one cross-industry 2025 benchmark, but frontline results vary widely, so track your own accepted-offer-to-first-shift conversion by location and investigate any sudden drop.