Introduction
In the world of frontline hiring, key performance metrics such as time-to-hire and hire rates can change quickly. We’ve prepared this report to arm recruitment leaders with the information they need to gauge team performance, improve efficiency, and meet hiring goals.
This quarterly insights report covers the first quarter of 2024 and focuses on the fast food industry. Understanding quarterly changes can prepare recruitment teams for the year ahead, as well as what to expect seasonally.
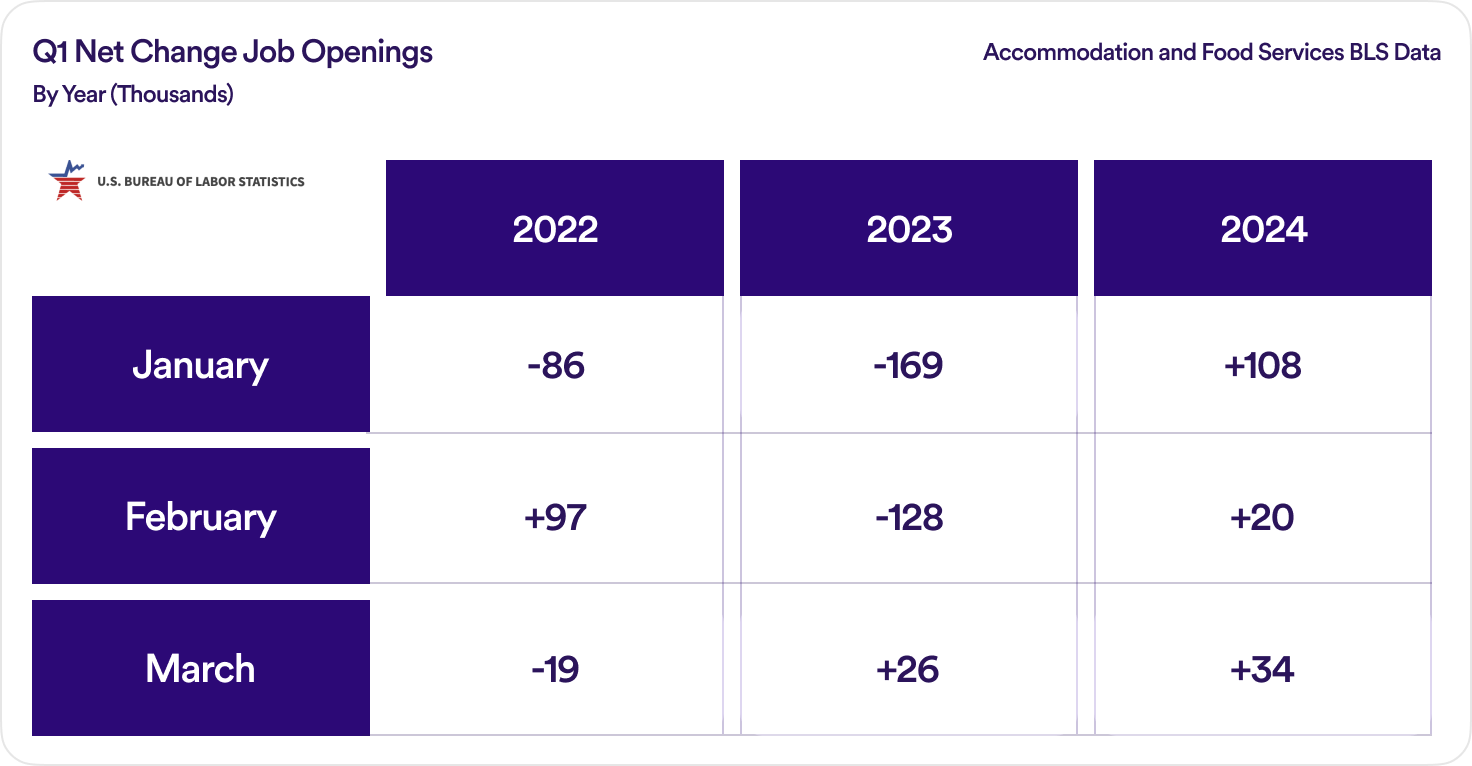
Data from the U.S. Bureau of Labor Statistics for Accommodation and Food Services shows that 2024 is the only year with net positive job gains through the first quarter (162,000 jobs) compared to 2022 and 2023.
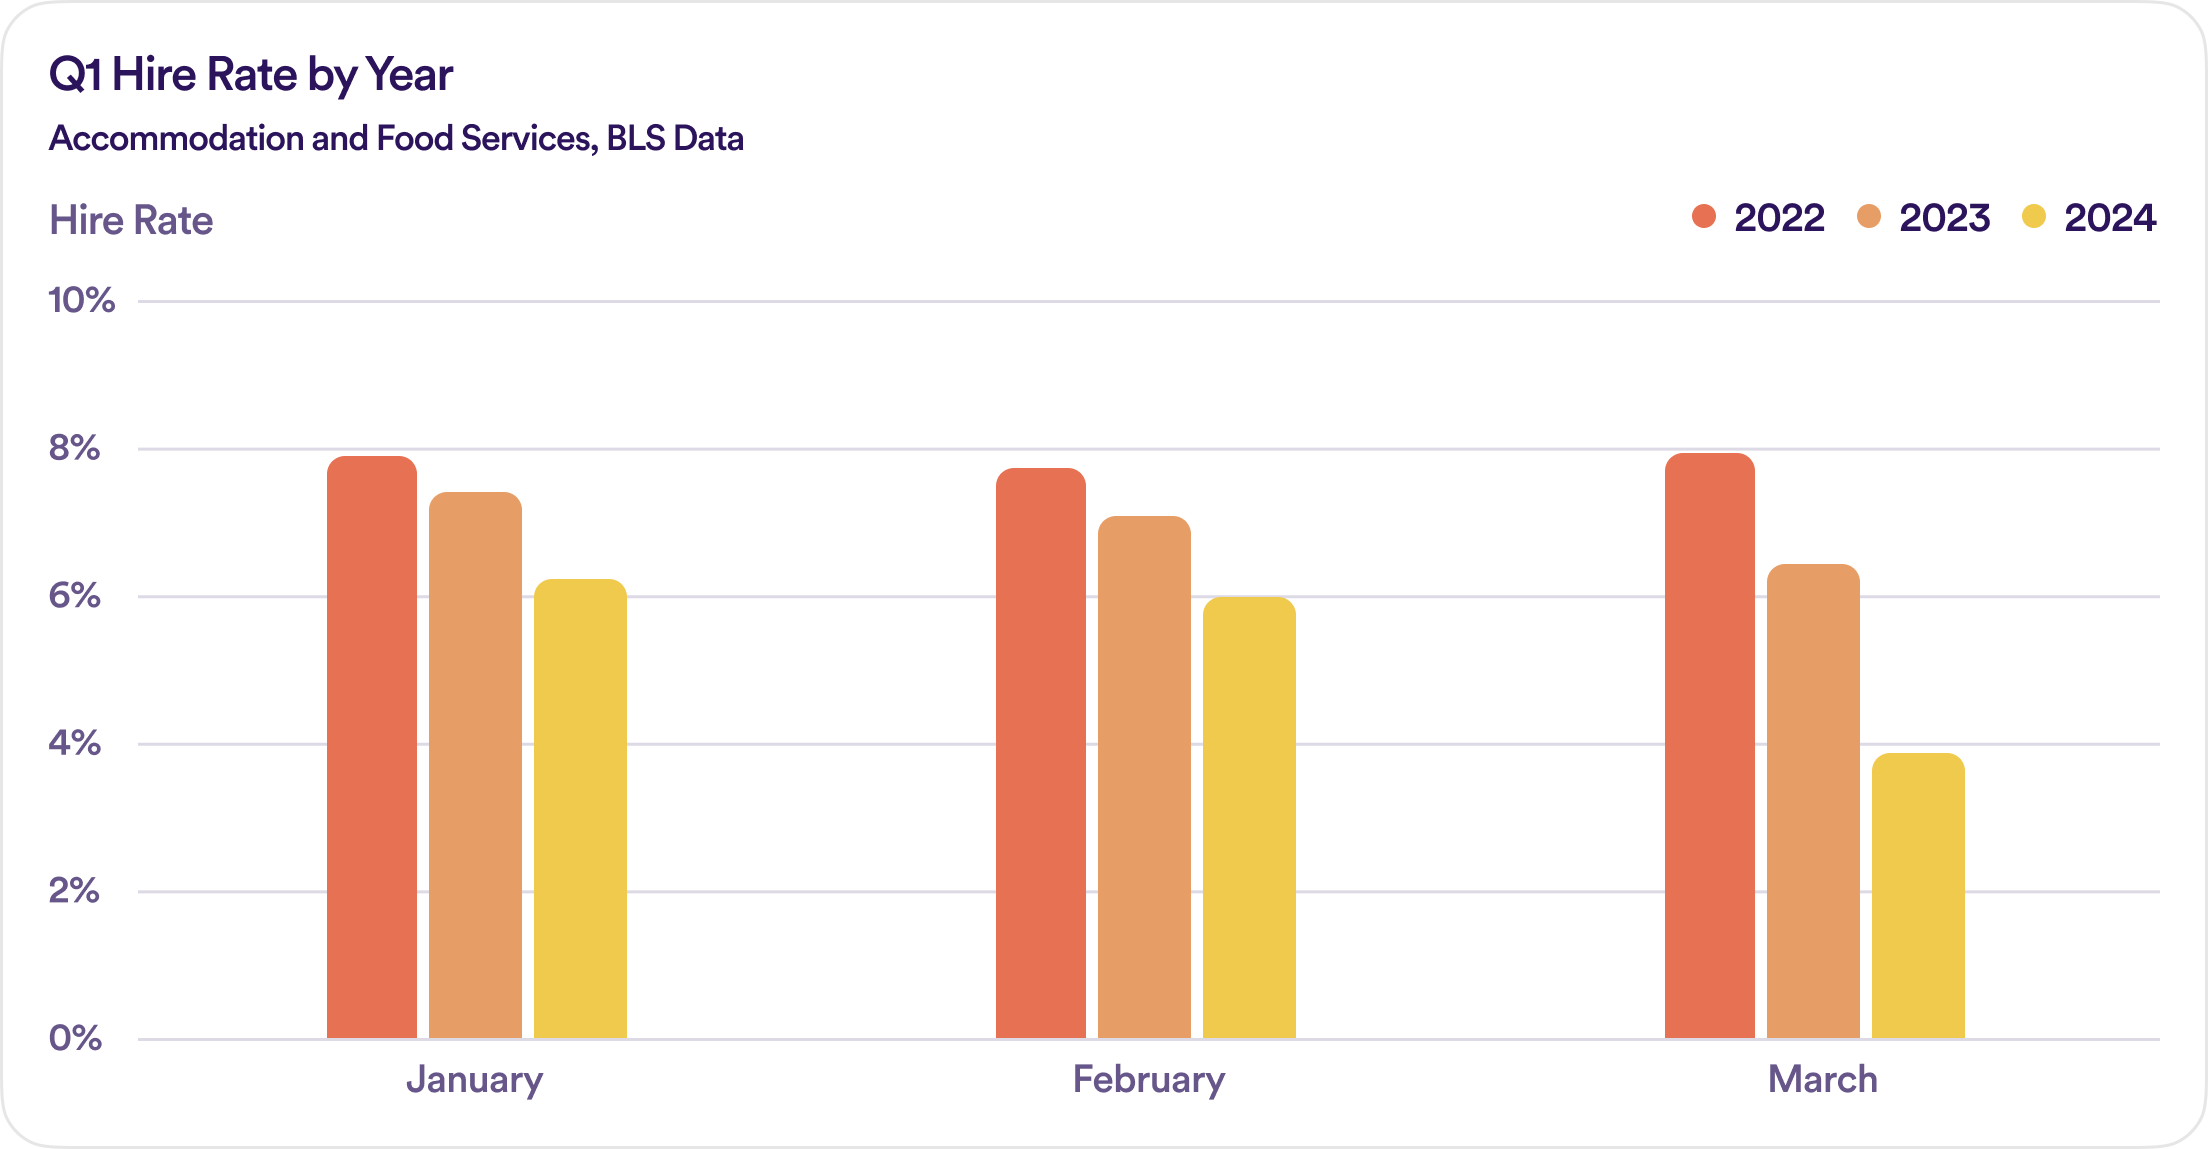
In contrast, hire rates (i.e.,, total hired out of total applied) decreased compared to prior years, which suggests a higher ratio of jobs compared to available applicants. Employers need to be savvy in order to capitalize on a limited labor pool.
We examined hiring data from Q1 2024 for our fast food customers. The data consisted of over 2,000 job openings that were live between January and March across the United States.
Part One of this report covers broad national trends related to: application rates, hourly pay by role, time-to- hire, and applicant demographics.
Part Two digs deeper into the hiring workflows utilized by fast food employers and examines factors related to performance based on time-to-hire and hire rate metrics.
Part One: National Metrics
Weekly Application Rates
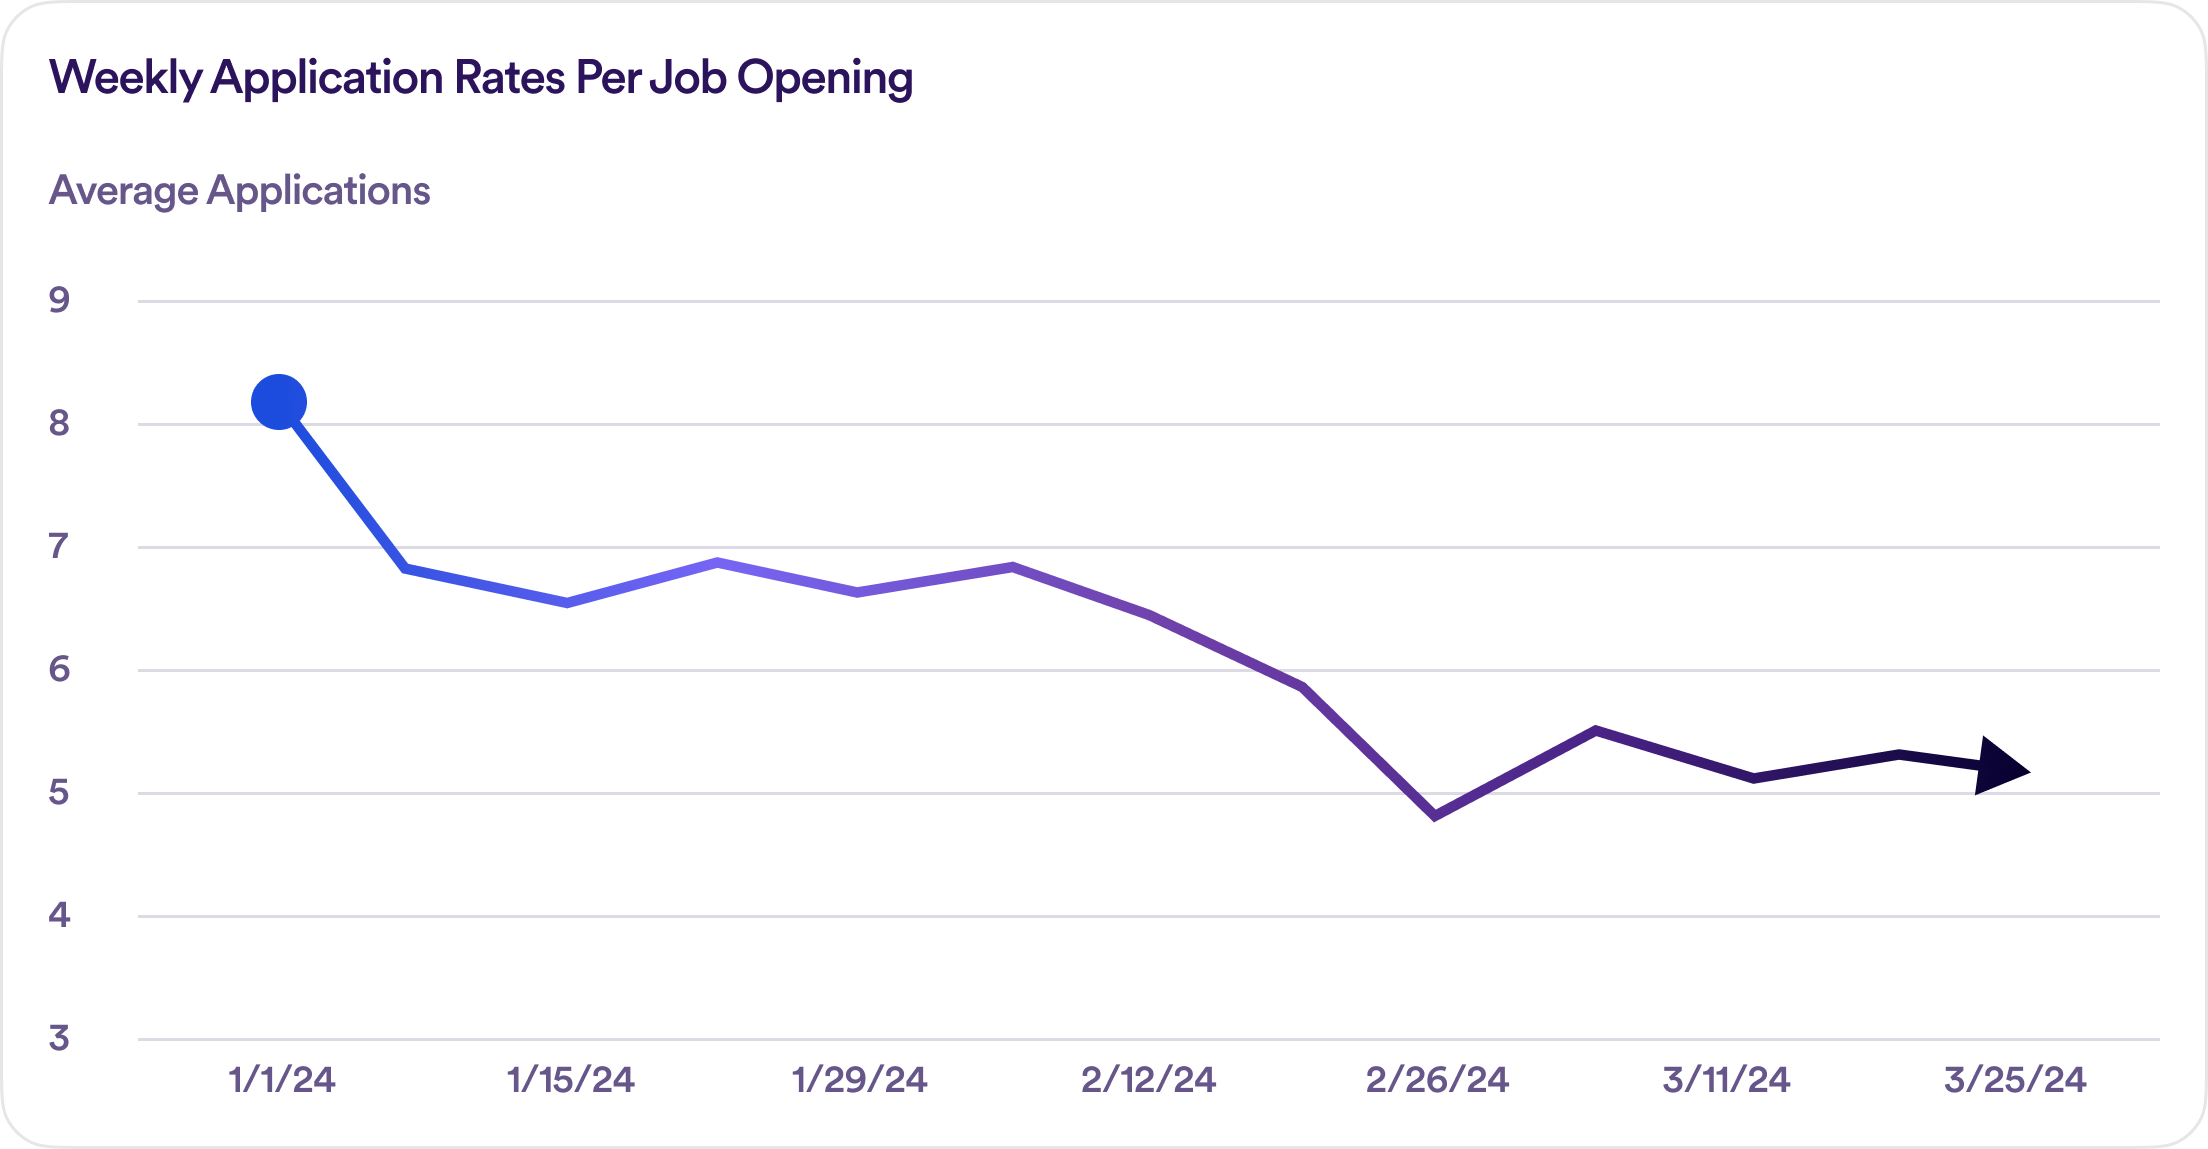
The following graph shows weekly application rates per job opening. The peak rate for this period was eight applications per opening, which dropped to five by the end of the quarter. The median average rate fell between three to five applications for this period.
Pay by Region
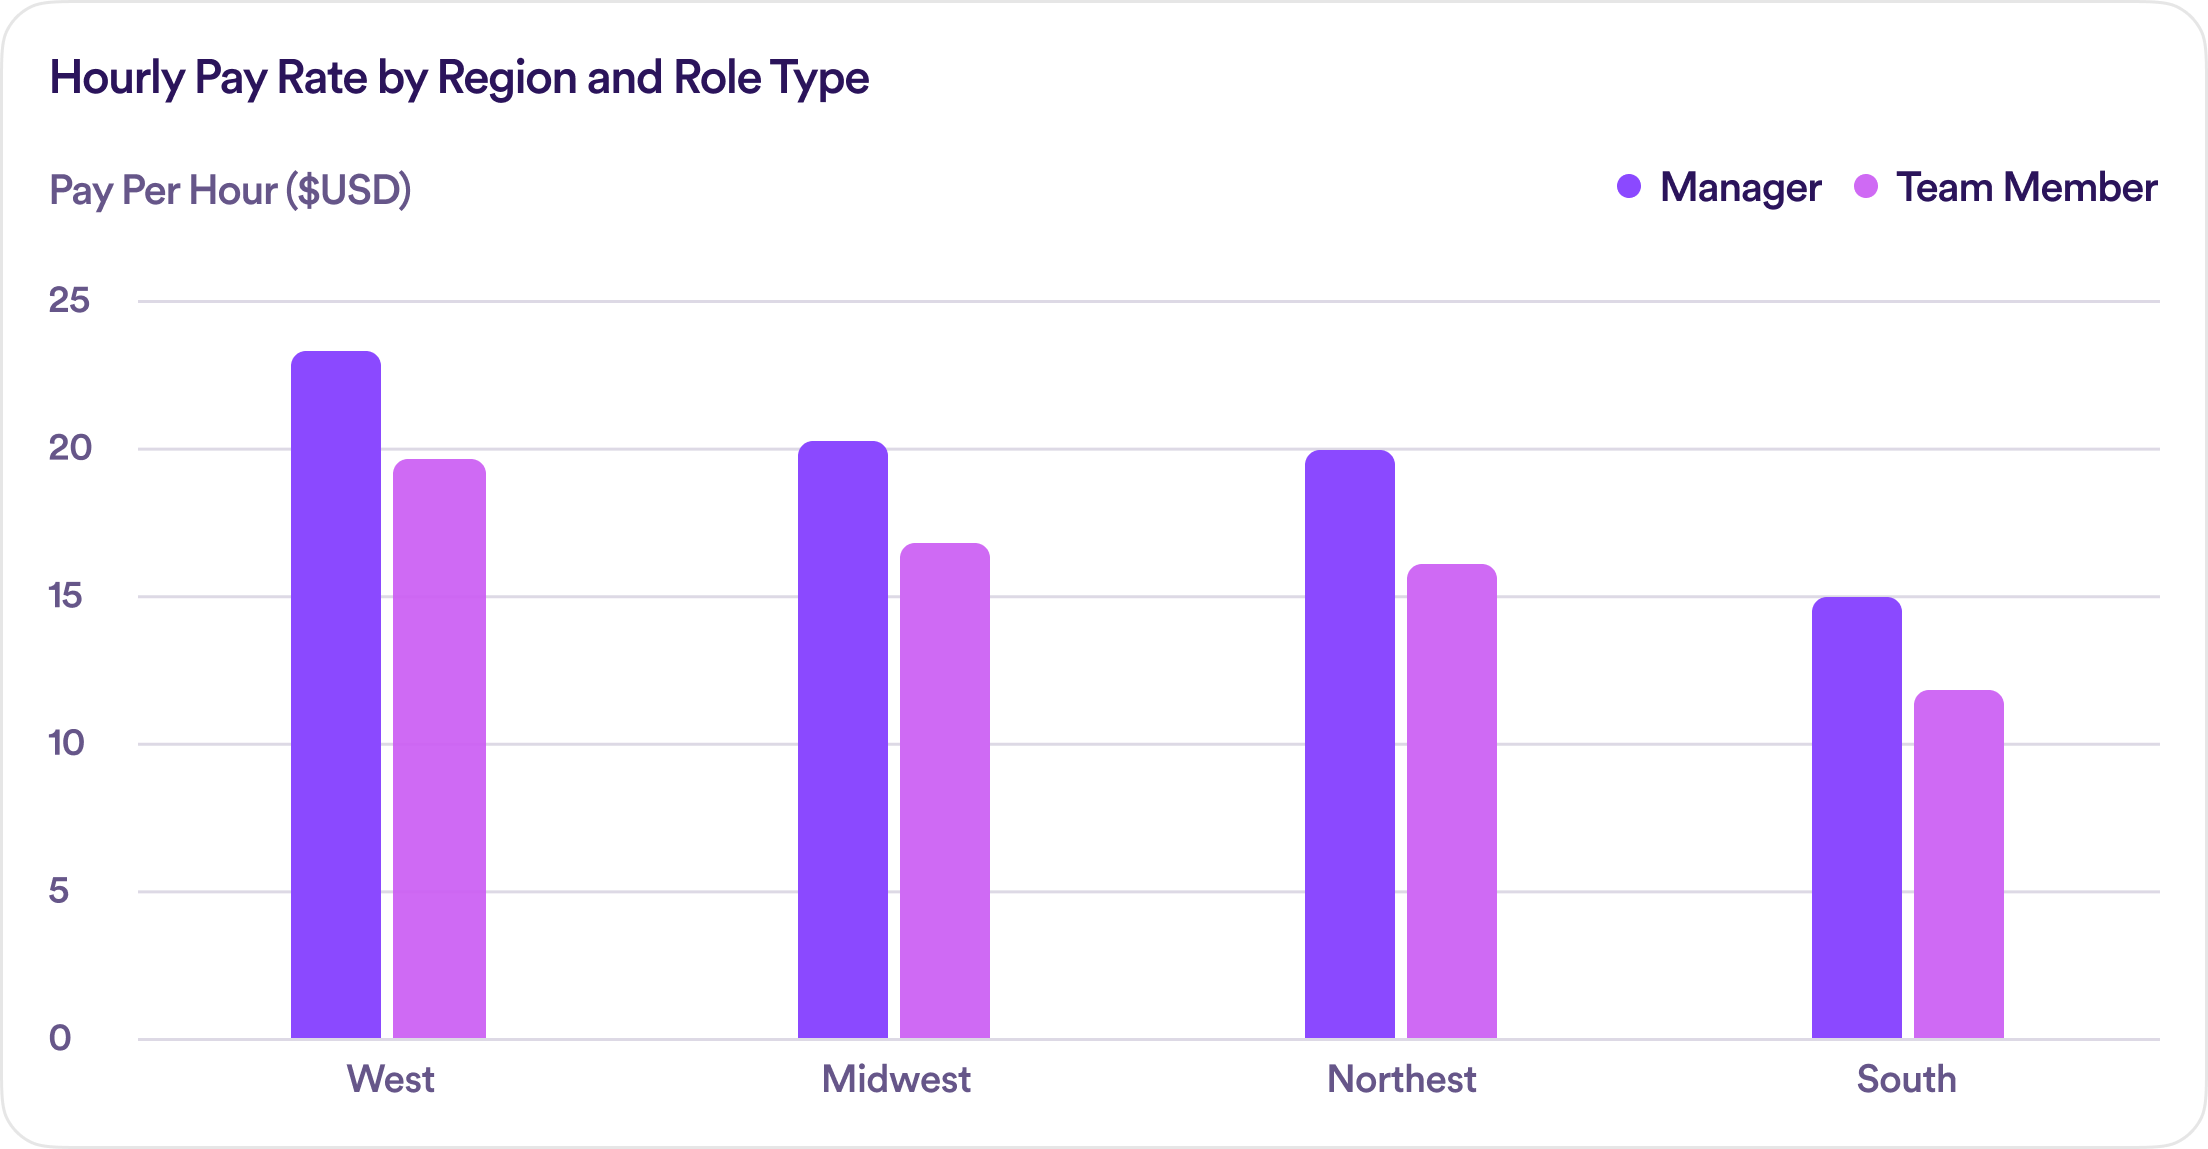
We split data between manager and team member roles for four U.S. regions: the West, Midwest, Northeast, and the South. The West had the highest overall pay for both role types, while the South offered the lowest hourly pay.
Team Members earn nearly $20/hour in the West compared to $13/hour for the South. Managers earn nearly $25/hour in the West compared to $15/hour in the South.
The dollar gain between Team Member and Manager roles is smallest in the South, with a $2 difference, while the Northeast had the biggest pay differential at $4 more per hour for Managers compared to Team Members.
Application to Opening Ratio by Region
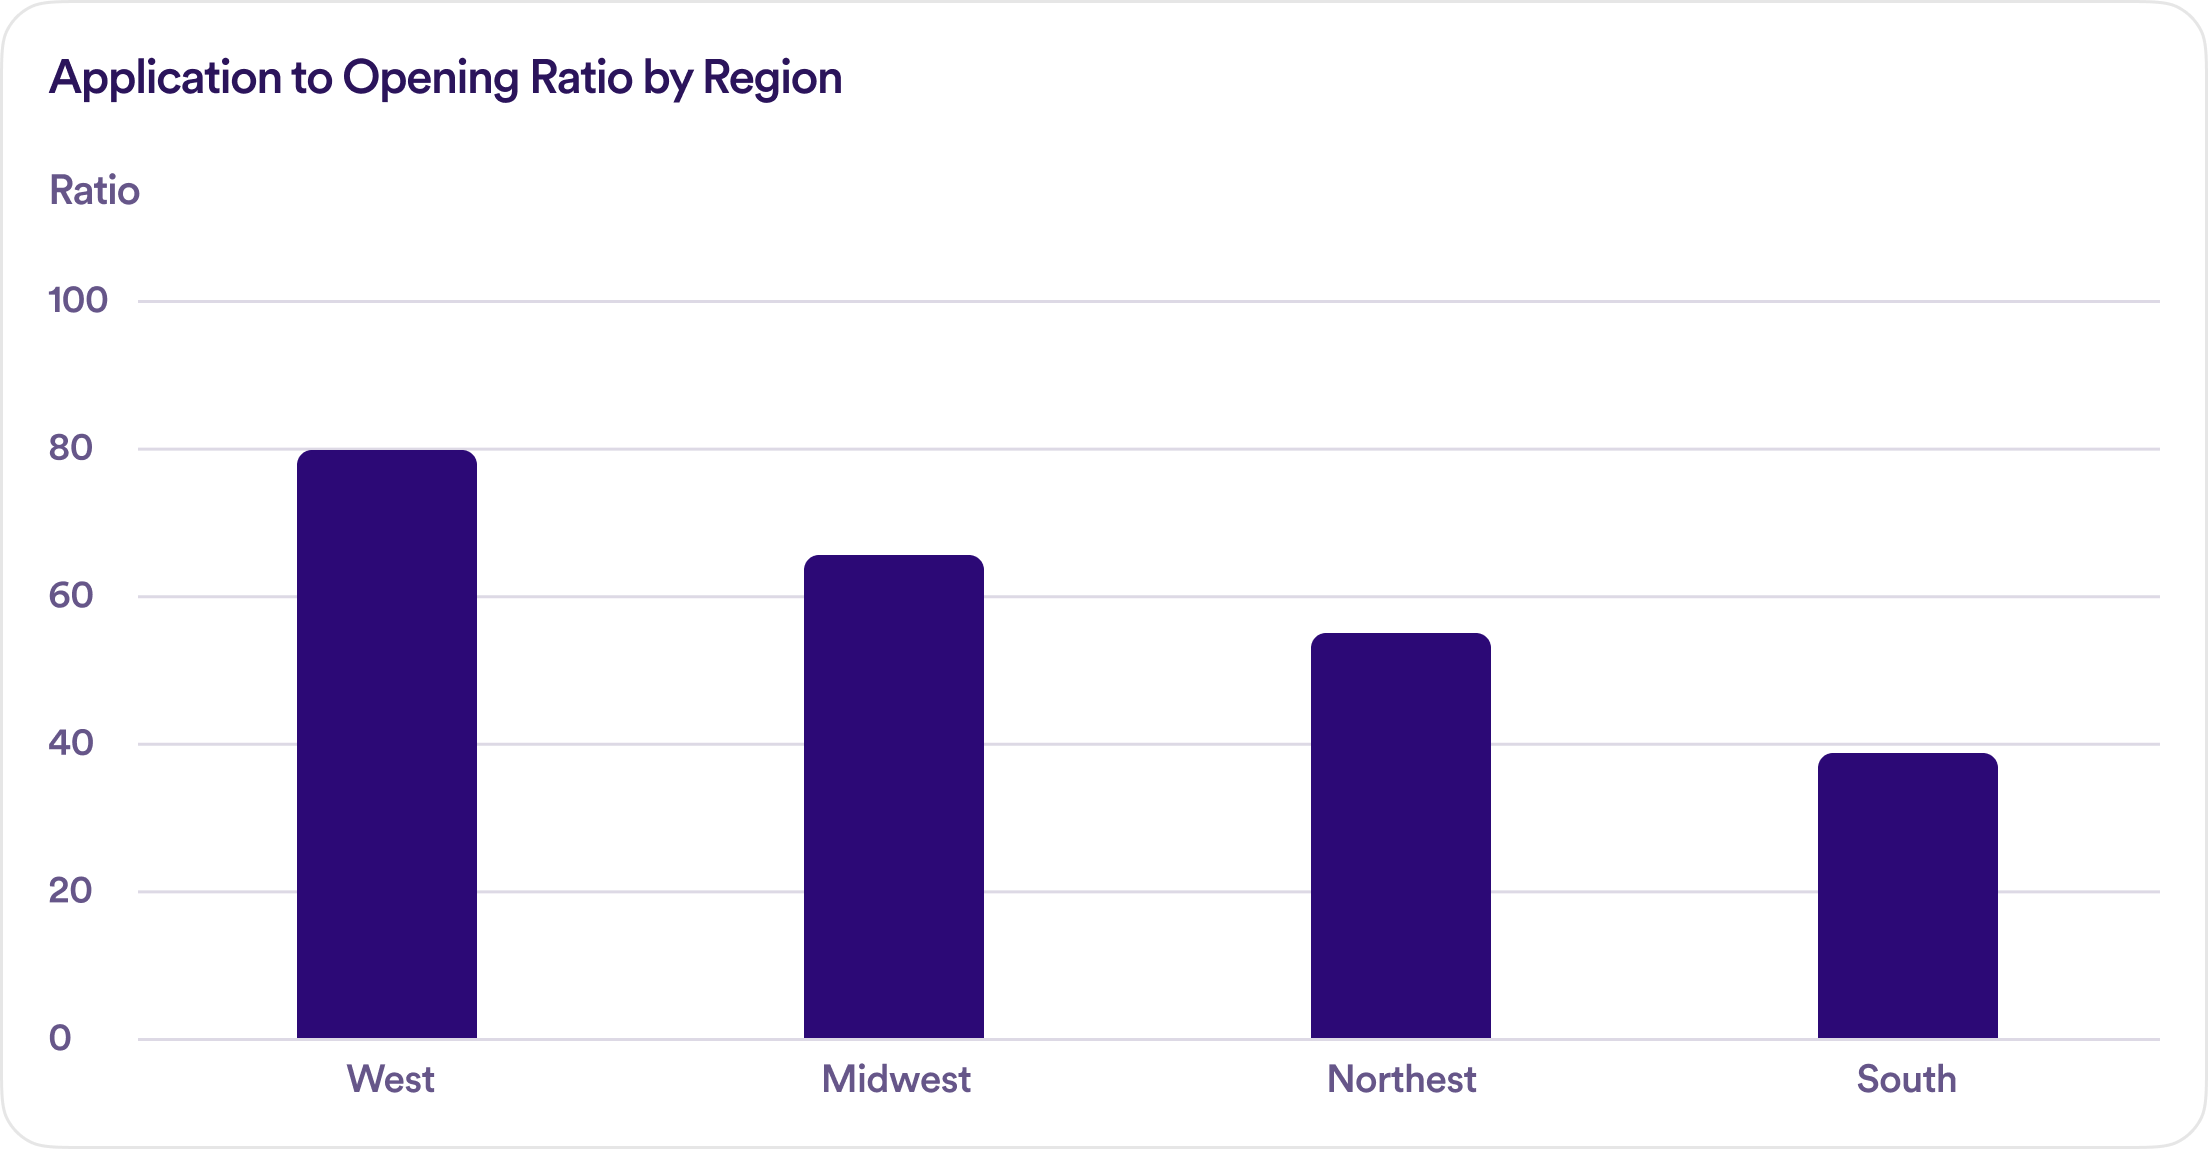
We looked at the ratio of applications relative to total job openings per region and found that applications (perhaps unsurprisingly) followed rates of pay. The West pulled in the highest ratio of applications followed by the Midwest then the Northeast, with the South pulling in half the number of applications compared to the West.
Time-to-Hire
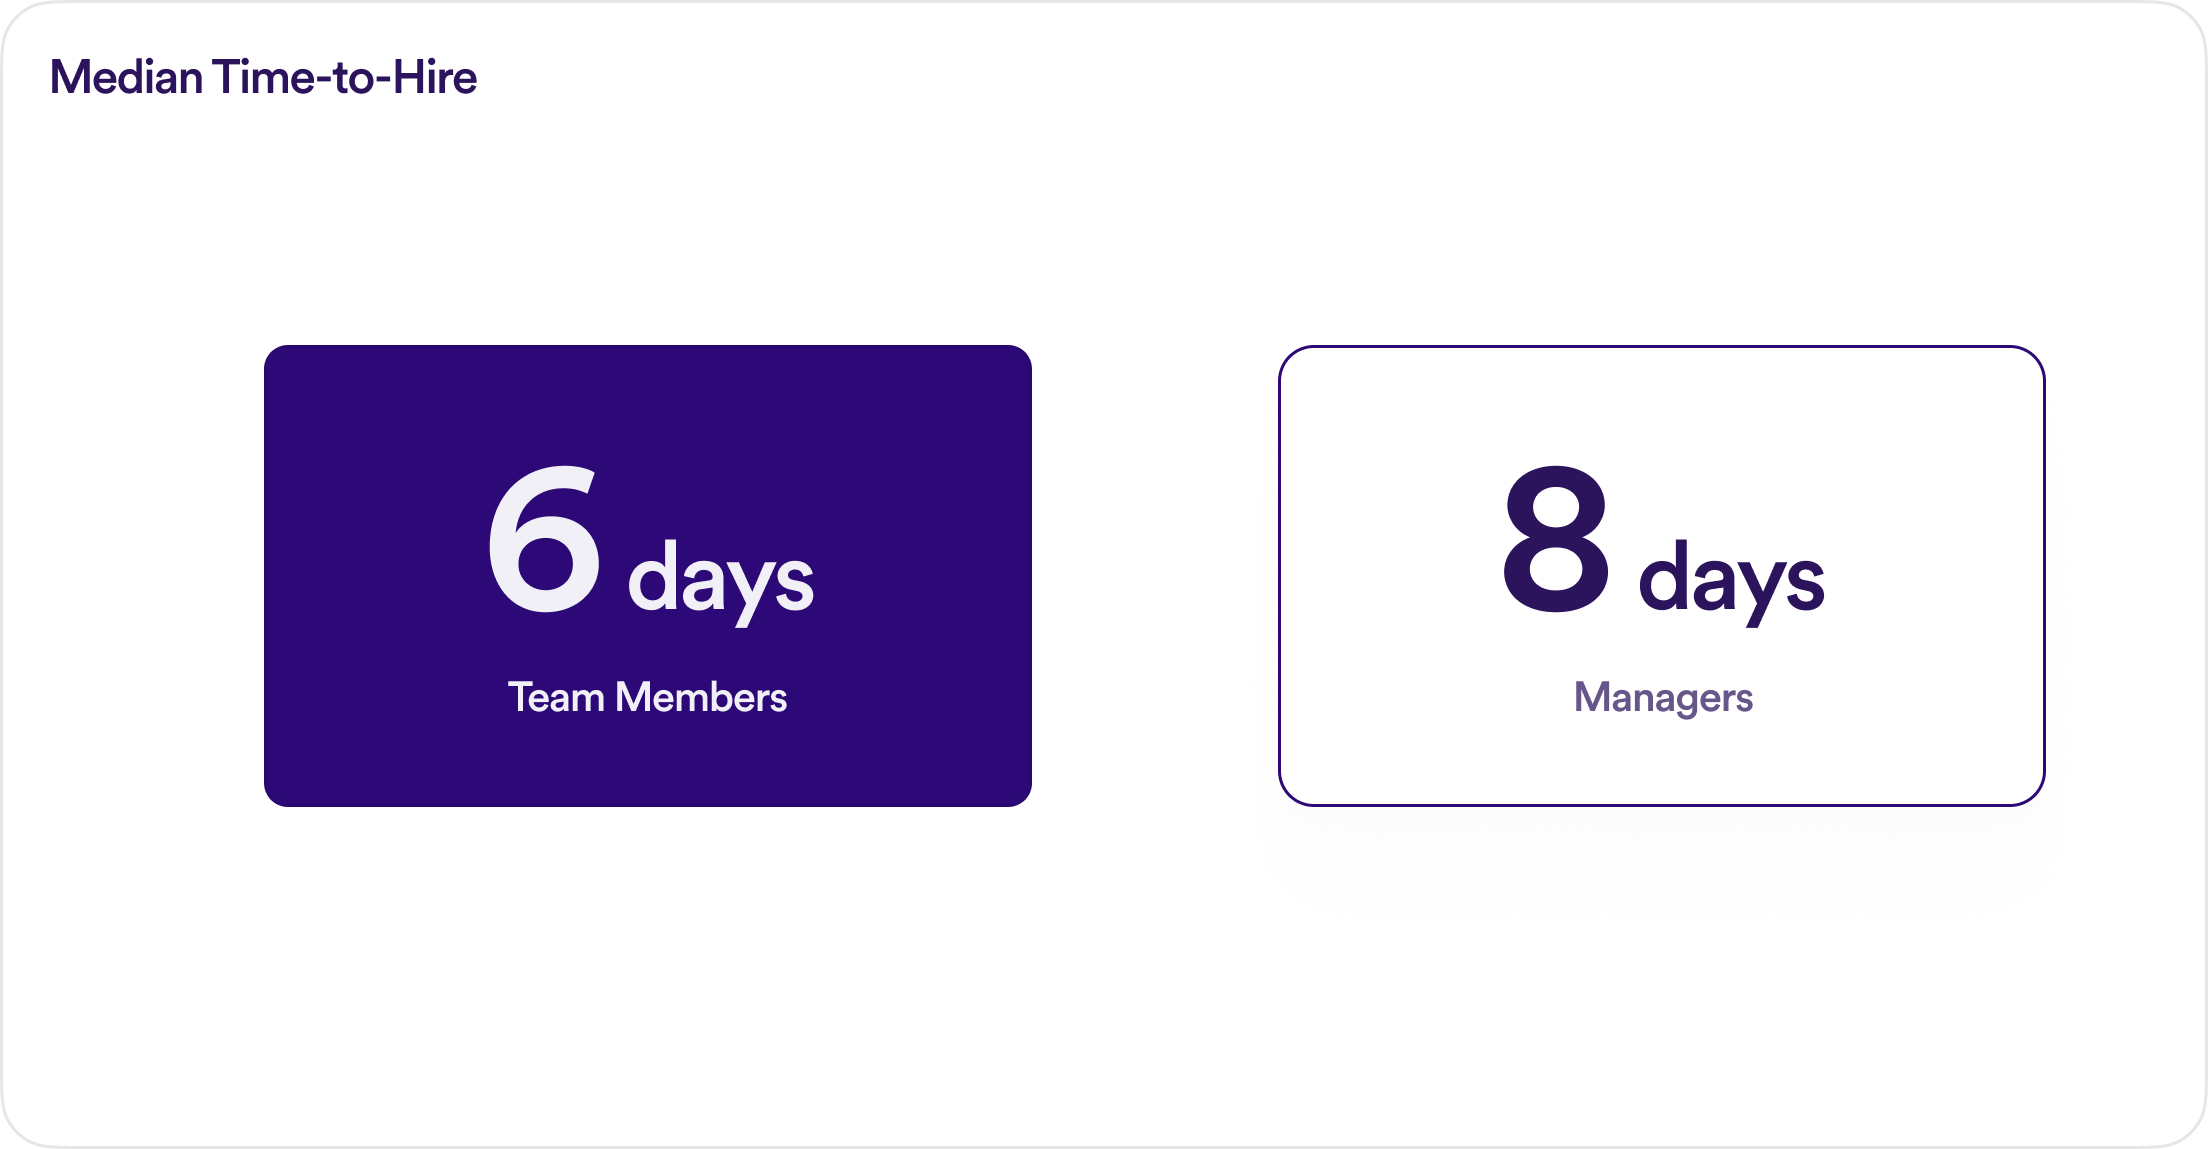
The median time-to-hire for Team Members was six days, with Managers taking an additional two days. We found no major regional differences in hiring time.
Applicant Demographics
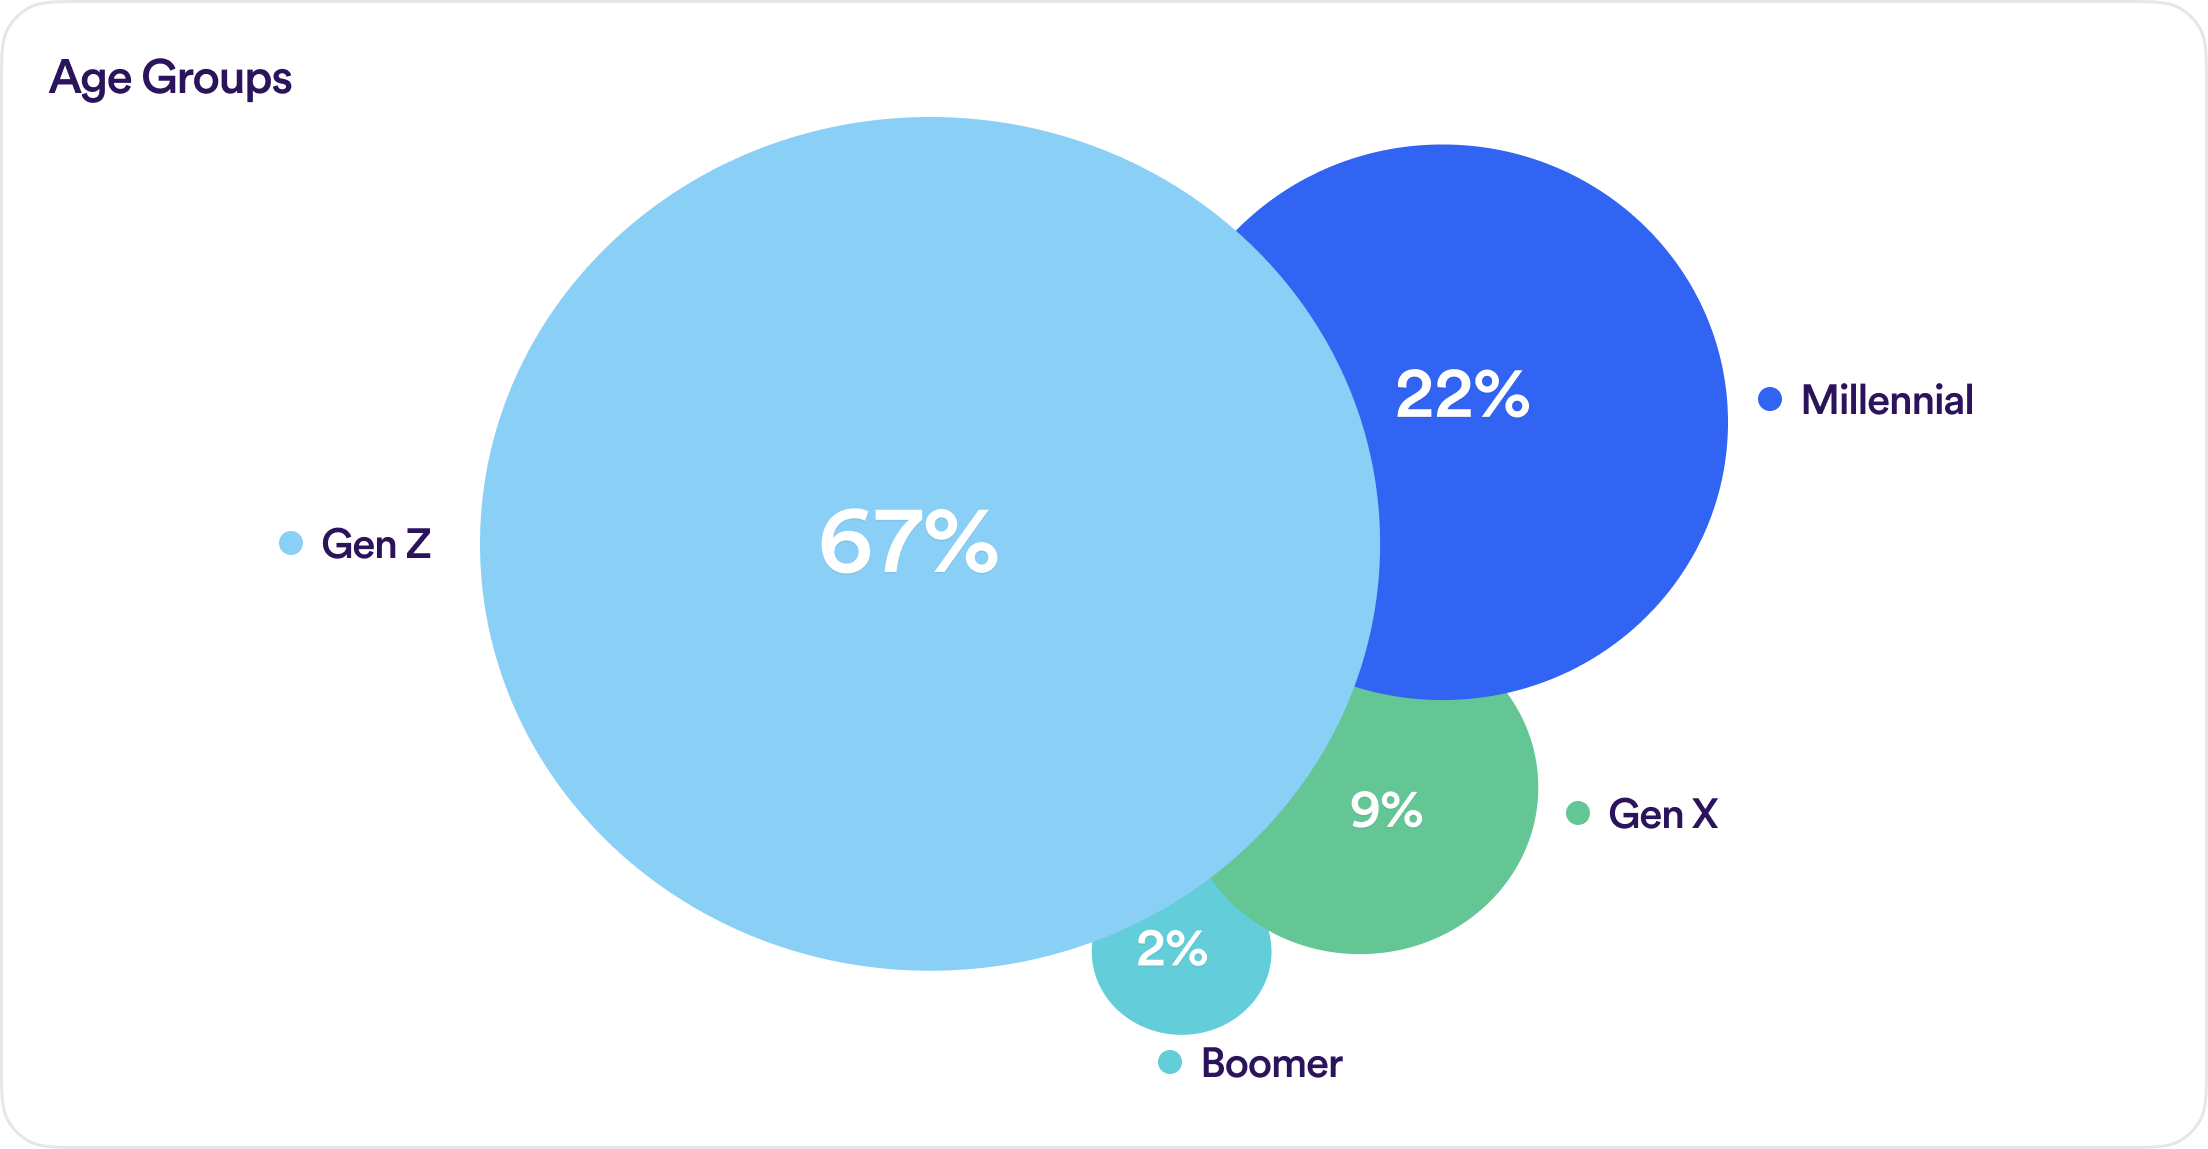
For those openings where the birth date was provided, we found that Gen Z applicants made up nearly 70% of all applications received in the first quarter. Millennials accounted for nearly 25%, with Gen X and Boomers taking smaller percentages.
Part Two: Hiring Workflow Performance
This section reviews more than 1,000 national hiring workflows that received at least 10 applications.
These workflows were scored according to their time-to-hire and hire rate during the period and split into four performance groups across a spectrum. Group A included the workflows that hired the fastest and hired the most applicants out of the total received, while Group D included the slowest time-to-hire and lowest hire rates.
The following sections will cover how workflows differed in terms of applicant communication, rejection reasons, and completion of hiring tasks.
Overall Performance Metrics
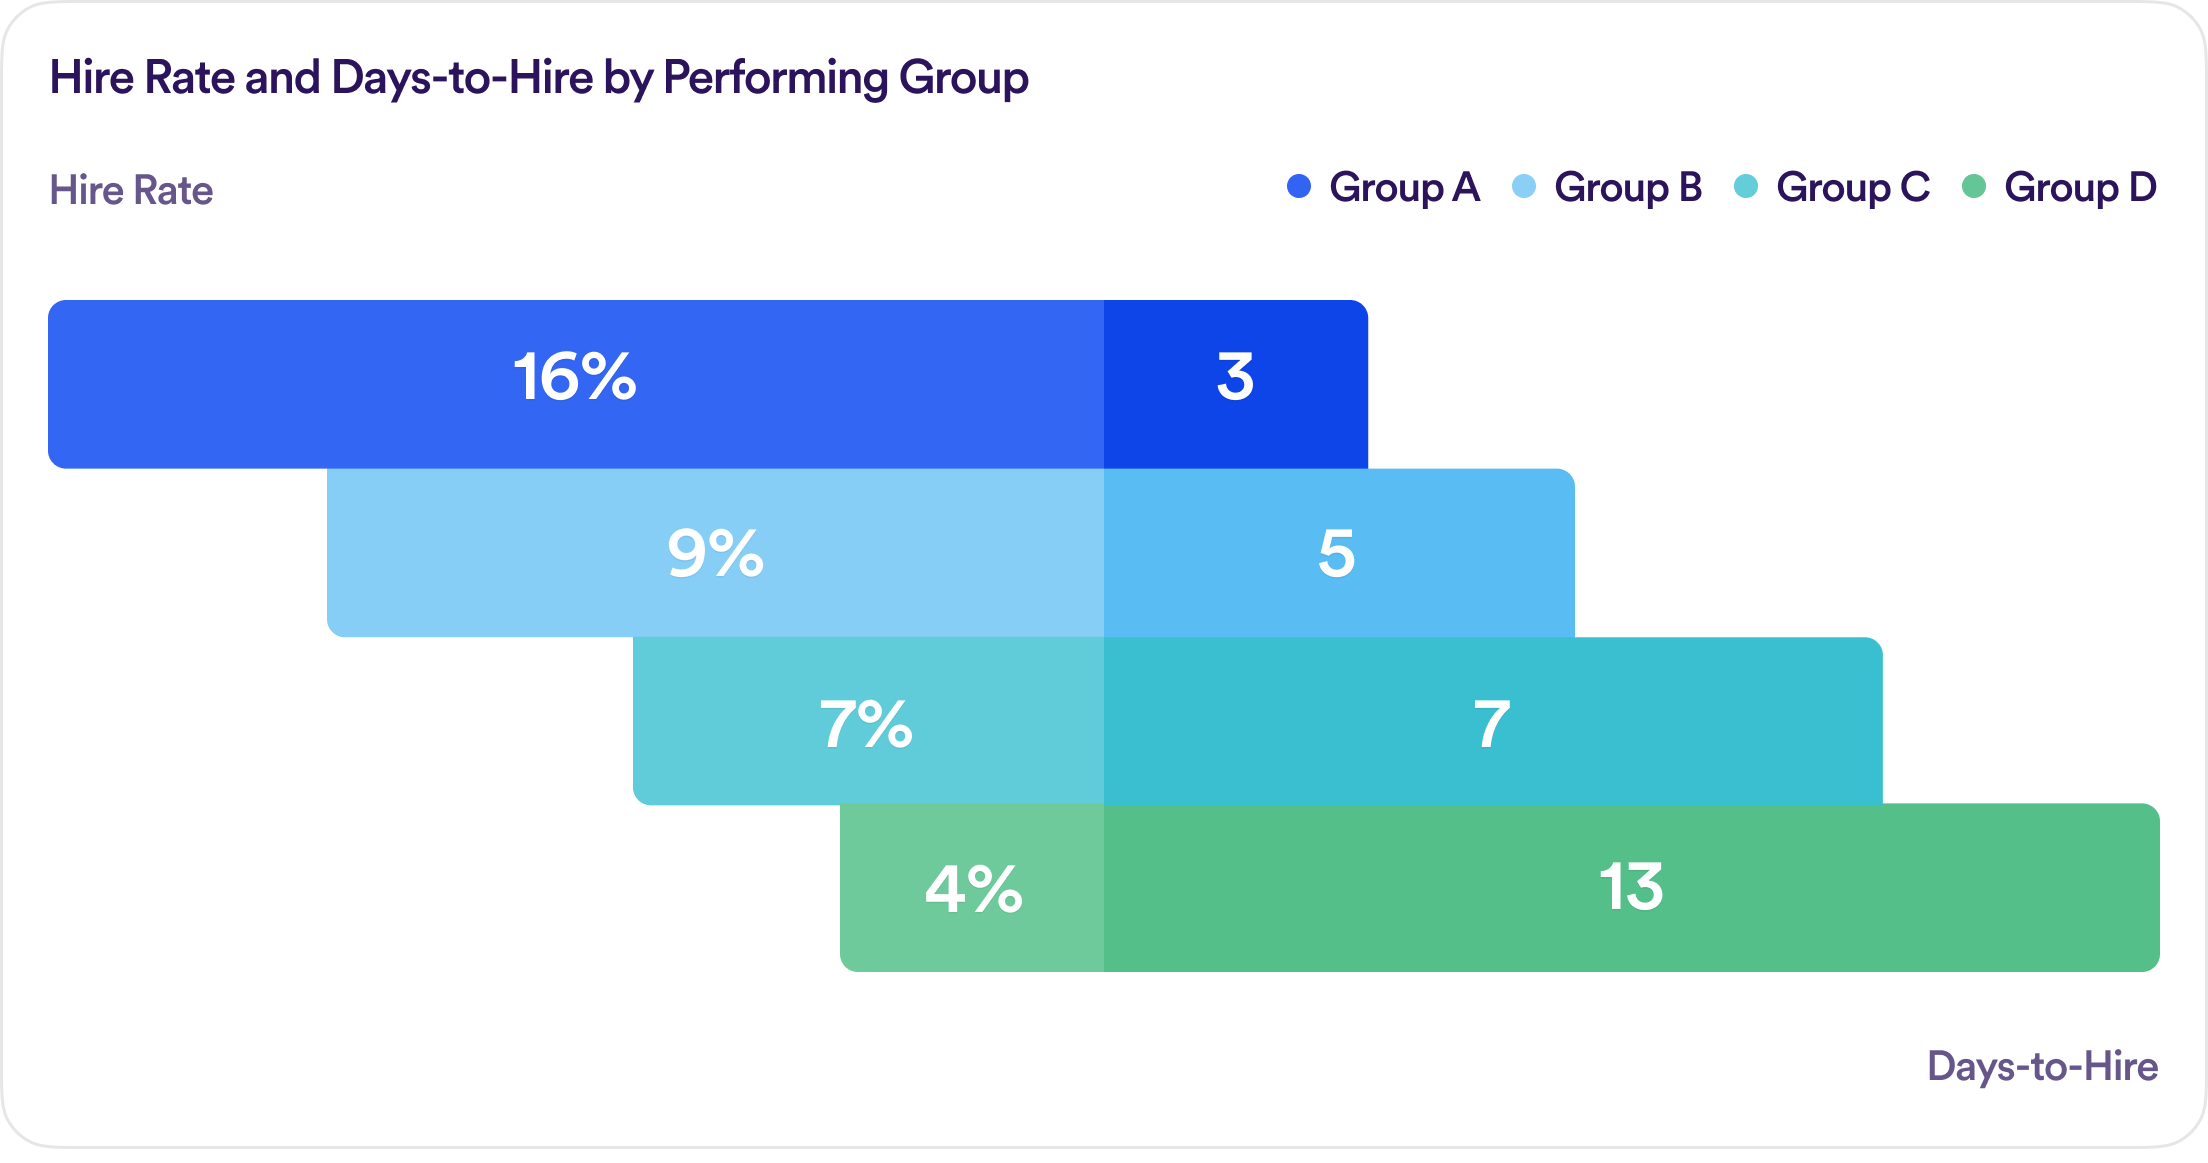
The typical time-to-hire across all four performance groups varied greatly, with Group A hiring within three days and Group D hiring within 13 days.
Hire rates followed the opposite trend: Group A hired up to 16% of all applicants and Group D hired 4%. There is a clear association here between speed and overall hiring volume. We outline specific attributes across each performance group below.
Applicant Communication
In order to assess patterns in applicant behavior across the four performance groups, we analyzed the sentiment and content of text messages sent by applicants. The following patterns emerged:
- Poor workflow performance was not significantly related to applicants requiring technical or other kinds of assistance.
- The best performers had higher rates of applicants asking questions about the role and reporting task completion.
- The worst performers had the highest rates of applicants rescheduling and canceling their inter- views, with Group D comprising nearly half of all texts related to cancellations.
- The worst performers also showed the highest rates of expressed apologies and gratefulness, indicating applicants did not necessarily cancel or reschedule due to negative experiences or behavior within the hiring workflow.
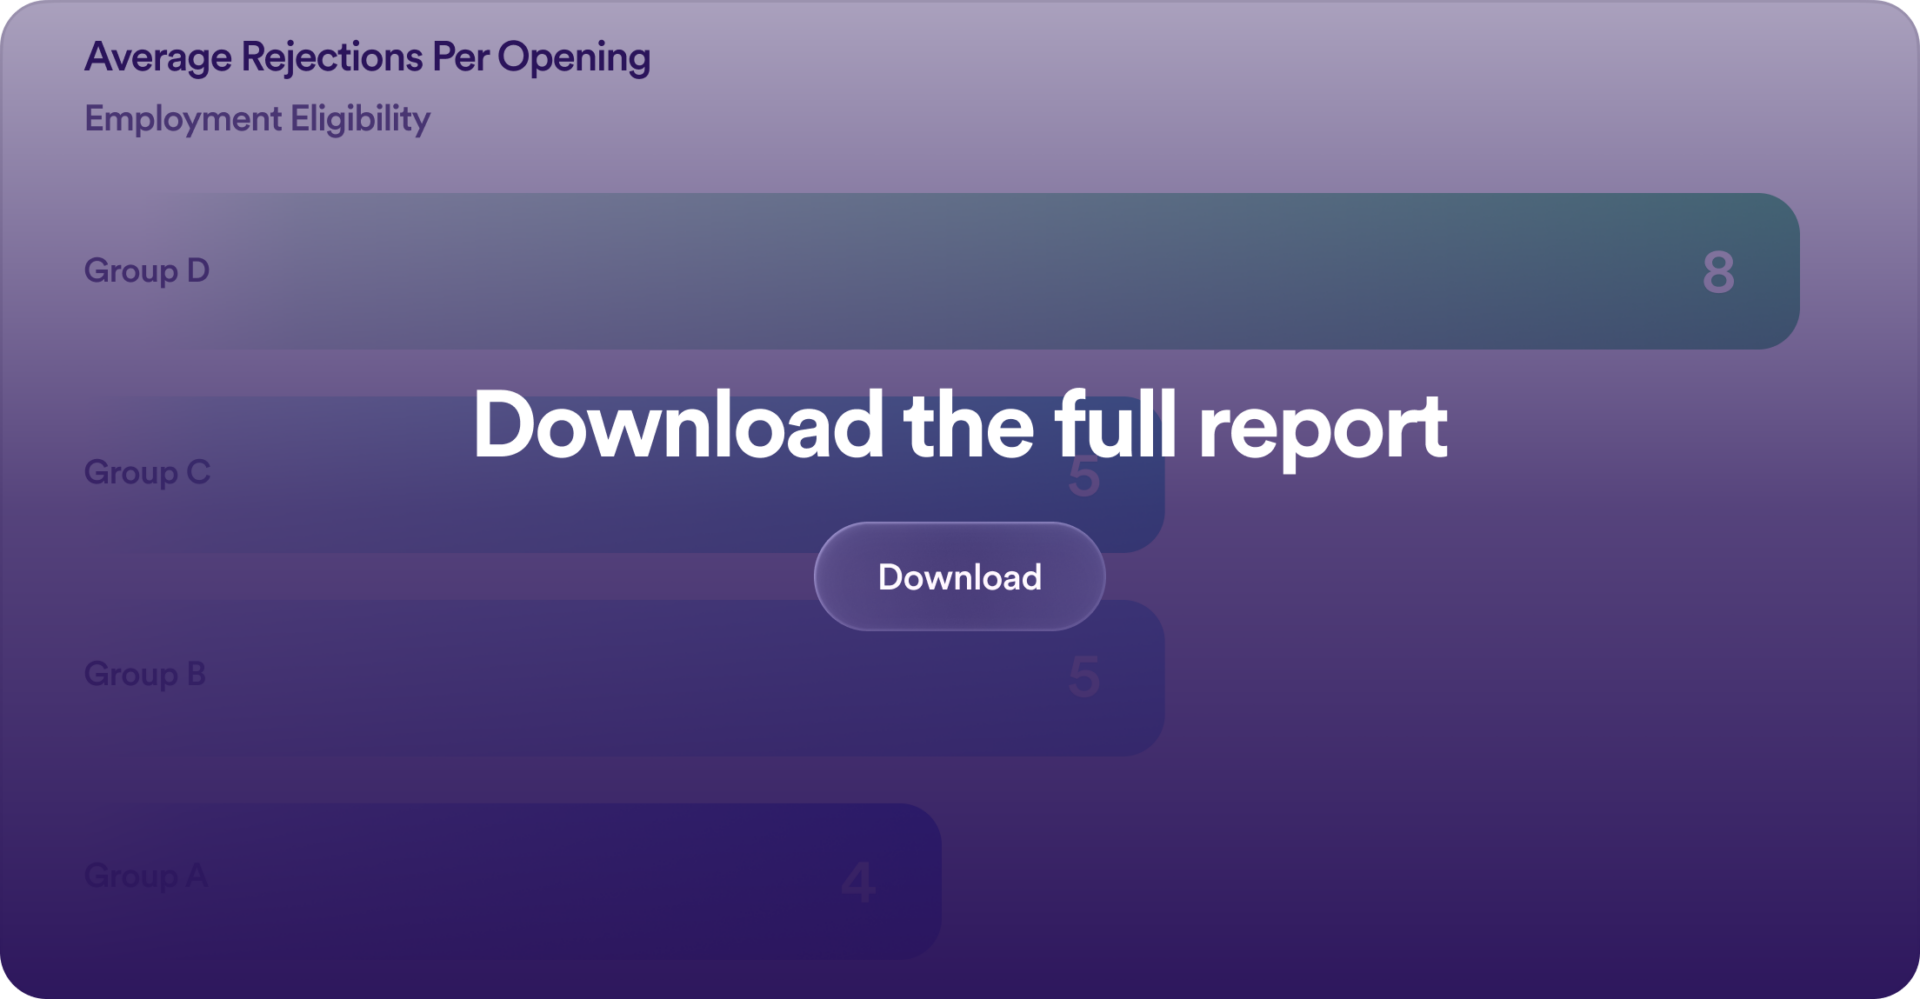
Applicant Rejections
We looked at rejection reasons during this time period to examine patterns that may have contributed to overall workflow performance. Out of the total applicant volume across all performance categories, applicant unresponsiveness was the top rejection reason, though it appeared at different average rates across the categories (see below). The graphics below show the average number of applicants rejected per opening for the specified rejection reason.
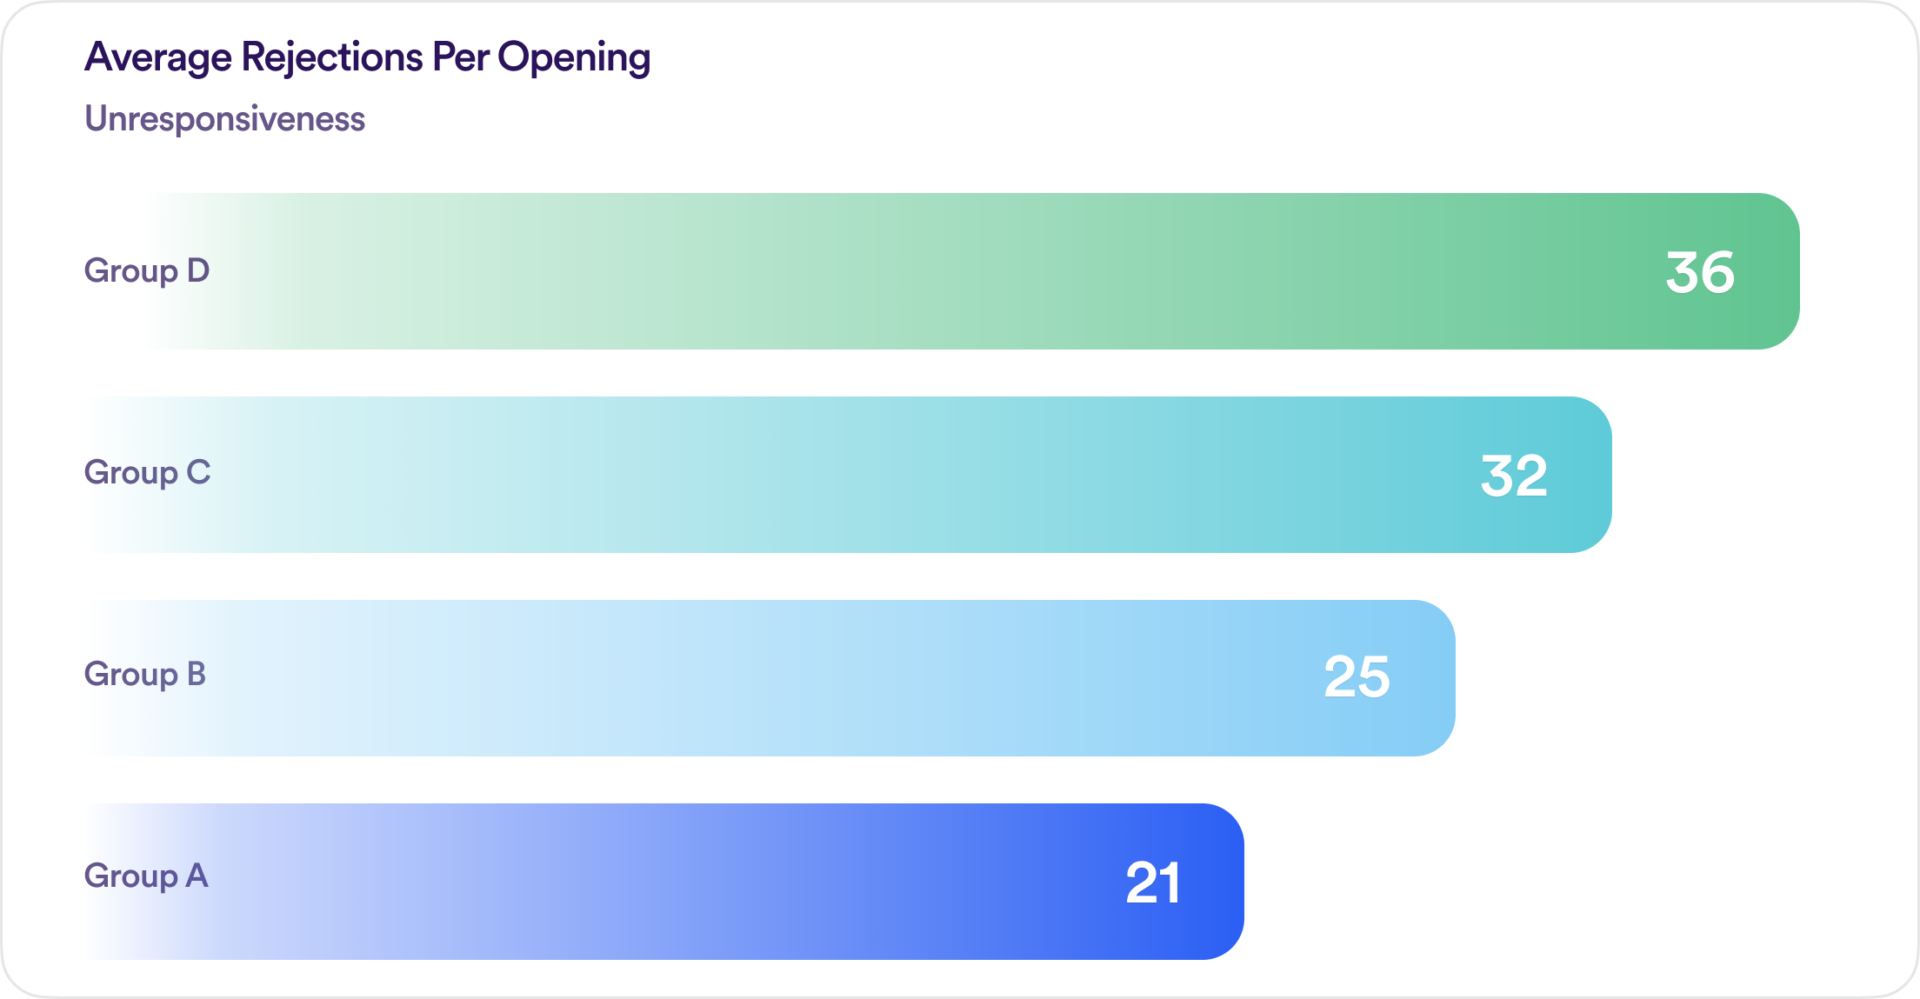
A rejection for unresponsiveness was most common for Group D, with up to 36 of all applications received per opening being rejected due to lack of communication. For context, the average number of applicants per opening was 47 for the quarter. Group A, on average, rejected around 21 applicants per opening.
We looked at the type of messages exchanged between applicants and employers and found that while the average count of outbound messages did not differ between performance groups, Groups A and B typically sent more manual messages from hiring managers compared to the worse-performing groups.
What can we learn from this? It’s clear that human interaction is a key factor in better hiring performance. Our prior time-to-hire report found that the fastest employers utilized automated texting in 80% of their messages, but our findings here show personal responses are also valuable to maintain forward momentum.
The second most common reason for an applicant rejection was ineligibility based on age, culture fit, lack of experience, transportation, or work authorization. While the employers in our data set all utilized auto-filtering to reject applicants based on not meeting requirements, we found that the most common reason for ineligibil- ity was based on culture fit, which was not screened for in initial data collection.
Since this is most likely to be assessed during an interview, employers are spending more time with applicants who are ultimately rejected, and time-to-hire increased as a result. Employers should consider incorporating questions into initial screenings that check for culture fit in order to optimize their time-to-hire.
An assessment stage that asks behavioral questions—and sets realistic expectations on what the job might entail—can aid employers in deciding which applicants should move through to the interview stage. It’s an easy addition to the workflow that can be completed by applicants in five minutes or less.