A hiring plan built at the corporate average is wrong almost everywhere it lands. Unemployment ran from 1.8% to 16.9% across U.S. metro areas in May 2026, per the Bureau of Labor Statistics, and demand, labor pools, and quit rates move by site too, so one company-wide headcount number overstates some locations and understates others at once.
Below are three worked scenarios, the process behind them, a template, and the metrics that tell you it held.
What is a workforce planning strategy?
A workforce planning strategy is a forecast of which roles a business will need, where, and when, paired with the hiring, employee onboarding, and scheduling actions that close each gap before it opens. Without it, recruiters open requisitions only after a site is short.
Two disciplines get blurred into it:
- Headcount planning answers how many people the budget supports this year.
- Workforce management runs today’s shifts with the people already hired.
Workforce planning connects the two, turning a forecast into requisitions, start dates, and trained crews months before a gap reaches a floor.
Frontline employers do this under harder conditions. Total separations in accommodation and food services ran 5.6% in April 2026, per the BLS Job Openings and Labor Turnover Survey, making replacement hiring a standing requirement rather than an occasional project.
Add a time-to-fill window long enough for competitors to close first, and the average-based plan breaks differently at every location.
The five steps behind every workforce planning strategy
Every scenario below runs the same five steps, adapted from the U.S. Office of Personnel Management’s workforce planning model. What keeps a plan from aging out is a named owner and a set frequency.
- Assess the current state every month. HR pulls headcount, tenure, and attrition by site from the human resources information system (HRIS) and reconciles it against site rosters, which rarely match.
- Forecast demand off the drivers operations already tracks. Operations and finance own the drivers, whether that is transactions, route volume, or an opening date, and HR converts them into headcount by site and role.
- Size the gap in cost terms, not just heads. HR compares supply against forecast per site and role while finance prices what closing it costs.
- Build the action plan where execution happens. HR sets requisition, sourcing, and onboarding timelines; site and regional managers confirm feasibility and own delivery.
- Monitor weekly and refresh quarterly. Site managers watch fill rate, overtime, and no-shows weekly; HR owns the quarterly refresh.
Automation can carry the repetitive per-site arithmetic and flag locations trending short. Judgment stays with people: managers approve headcount changes and sign off on exceptions.
Three workforce planning strategy examples
The scenarios below are illustrations, not customer results. Each builds a forecast, a gap, an action list, and one success metric for a single site.
Example 1: staffing a seasonal demand surge
For a seasonal surge, the plan sizes hiring by site, adds expected attrition, and works backward from the launch date. A 60-location quick-service restaurant (QSR) chain is heading into a summer promotion launching June 15, and the corporate instinct says hire 180 across the network.
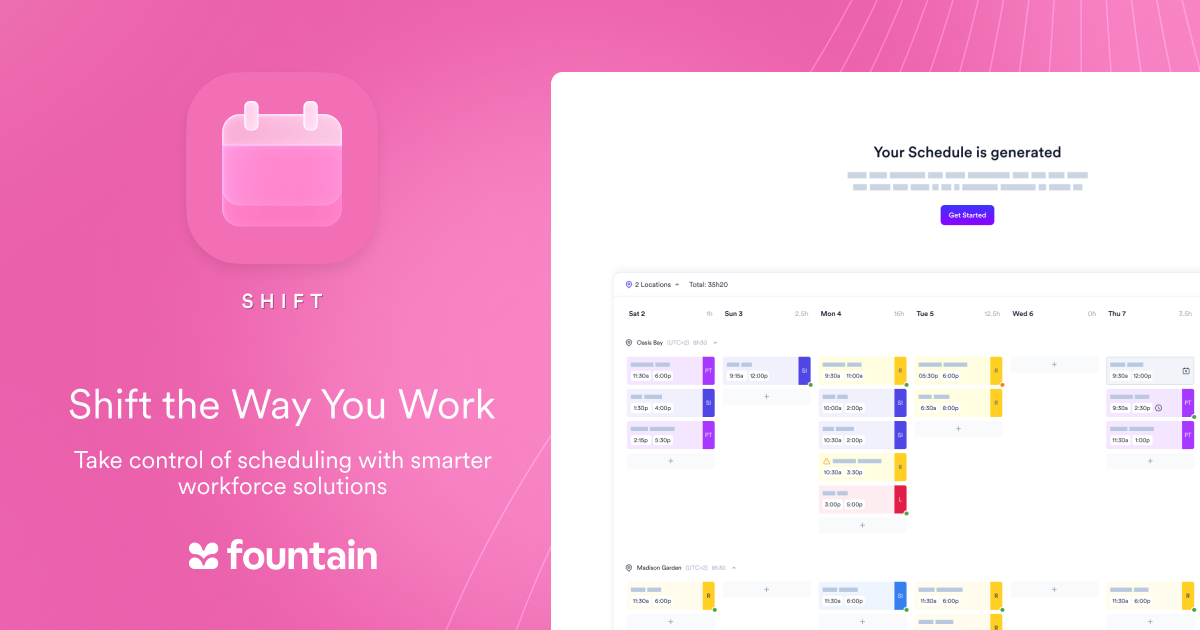
Smart, flexible scheduling built for frontline teams—because flexibility is essential, not optional.
Optimize your frontline workforce management with Fountain Shift—the all-in-one mobile scheduling solution designed to streamline operations and enhance employee satisfaction.
Automate shift creation, minimize errors, and empower your team with mobile access to schedules, time tracking, and seamless shift management. Experience the future of workforce scheduling today.
Site 14 forecasts 30% more transactions from mid-June through August, runs 22 crew today, and staffs to volume, so its target is 29 and its base gap is 7. Because food-service separations run high, it assumes two to three departures inside the window and hires 10, not 7. The site across town, with flat volume, may need one.
The surge date is known months out, so hiring dates backward from the forecast, not from the day the schedule breaks.
Restaurants were projected to add 450,000 seasonal jobs this summer, per the National Restaurant Association, with hiring ramping in April and peaking June through August. That puts requisitions open in early April, alongside a crew referral push and last summer’s applicant pool reactivated.
Success is a roster of 32 by June 1, so 29 stay scheduled through August with overtime under this operator’s 5% ceiling.
Example 2: planning for chronic turnover replacement
For chronic turnover, the plan converts predictable attrition into standing monthly requisitions weighted toward the sites losing people fastest. A last-mile operator runs 600 delivery drivers across 12 sites, where hiring never stops even though headcount never grows.
Fountain’s August 2025 frontline trends analysis puts annual turnover at 73% in logistics and warehousing, so a fleet this size sheds 438 drivers a year, or 37 a month, just to hold flat.
The network total is predictable. The site split is not: three sites churning at double the network rate account for 40% of annual loss while the quietest replace a handful of drivers a year. Demand that predictable belongs in a standing monthly requisition: 37 driver reqs on the first of every month, sourcing weighted toward the three high-loss sites, a warm pool of past applicants there, and a real investigation into why those three churn twice as fast.
Replacing a private-fleet driver costs about $11,800, per Logistics Management reporting private-fleet benchmarking data. Planned, that spend sits in the budget. Run as 37 emergencies, it arrives with rush job-board premiums, overtime, and uncovered routes on top.
Example 3: opening new locations
For new openings, each store’s plan runs backward from opening day in two waves: leadership first, volume hires second. A grocery operator is opening four stores in a new region across two quarters, each targeting a roster of 55 (one general manager, four department leads, 50 volume hires) from zero.
Wave one is the five leaders, who need the pre-opening window to finish training and help recruit their own team. Wave two is the 50 cashiers, stockers, and deli staff, started early enough to clear onboarding and two weeks alongside experienced staff.
The compliance homework is local, and it is due before the first requisition posts. Seattle’s secure scheduling ordinance, for example, requires covered retail and food-service employers to give a written good-faith estimate of median hours and post schedules 14 days in advance.
Rules like these vary by city and state, so treat this as orientation rather than legal advice and confirm your obligations with counsel. New-site plans break on sequencing, not on the total: the general manager starts late, training compresses, and the schedule misses a notice rule nobody checked.
The measure is Day 1 readiness at all four stores, a full roster trained and scheduled inside the local notice window.
All three follow the same sequence: gap sized by site, actions dated backward, one number that confirms it held.
The workforce planning template behind all three examples
The three scenarios reduce to one per-location table. The demand driver changes; the columns don’t. Here is a filled row from Example 1, repeated for every site and role.
| Location | Role | Current headcount | Forecast demand | Gap | Action | Owner | Target date |
| Site 14 | Crew member | 22 | 29, plus 3 for in-surge attrition | 10 | Open reqs April 7, referral push, interviews done by May 15 | Regional recruiter + site GM | Fully staffed June 1 |
The two fields people leave blank and later regret are owner and target date. A gap of 10 owned by a named recruiter against a June 1 date is a commitment someone can miss, and therefore manage.
Metrics that tell you the plan is working
Read every metric by location, because a healthy network average can conceal three sites running at twice the time-to-fill.
- Time-to-fill by site: SHRM’s 2026 benchmarking puts the median at 39 calendar days for nonexecutive roles. A site well above its vertical’s norm needs a funnel diagnosis, not a bigger job-board budget.
- Turnover and 90-day retention by site: A site losing half its hires by day 90 needs twice the gross hires to net the same crew, which is what makes early retention a planning input.
- Labor cost as a share of revenue: Limited-service restaurants ran a median 31.7% of sales on wages and benefits in 2024, per the National Restaurant Association. A site above its band is either overstaffed or covering vacancies with overtime.
- Forecast accuracy by site and role: Track planned against actual headcount so a miss registers as a planning error, not a hiring one.
A site can fill roles in 12 days and still miss plan if half those hires leave by day 90, which is how a speed dashboard hides an understated hiring target.
Where workforce planning strategies break down (and how to avoid it)
Workforce plans break on operations, not analytics. Survey research summarized by SHRM Labs found 92% of HR professionals call workforce planning important while only 42% say their organization does it effectively.
- Sites plan in isolation. Treated as a purely local function, planning yields a separate plan per site and no network view. Central governance with local flexibility fixes it: templates set once and adjusted locally, plus enough pipeline visibility to route surplus applicants to nearby gaps.
- Headcount data goes stale across systems. Applicant tracking system (ATS) and HRIS numbers that don’t reconcile produce three versions of current headcount, and the plan inherits whichever export ran last. Name one system of record.
- Nobody owns the plan or its refresh. An unowned plan ages out the week after approval, which is why the template carries an owner column. Put the quarterly review on the calendar before approval, and let line managers own their own site forecasts.
None of these fixes require new analytical capability. Each needs a named owner and a date, and both can be in place inside a quarter.
How Fountain runs workforce planning across every location
One location’s gap takes a manager minutes. Doing it for 40 sites every quarter, routing every requisition and tracking which ones moved, doesn’t fit in anyone’s week. Fountain runs that loop through Cue, the orchestration layer inside every Fountain product and the core of its Frontline Superintelligence.
A regional leader types “Forecast headcount for all 40 sites through Q4 and flag any site short more than 5 heads,” and Cue surfaces the short locations and routes each hiring action to the right recruiter. Managers still approve the headcount changes and the exceptions.
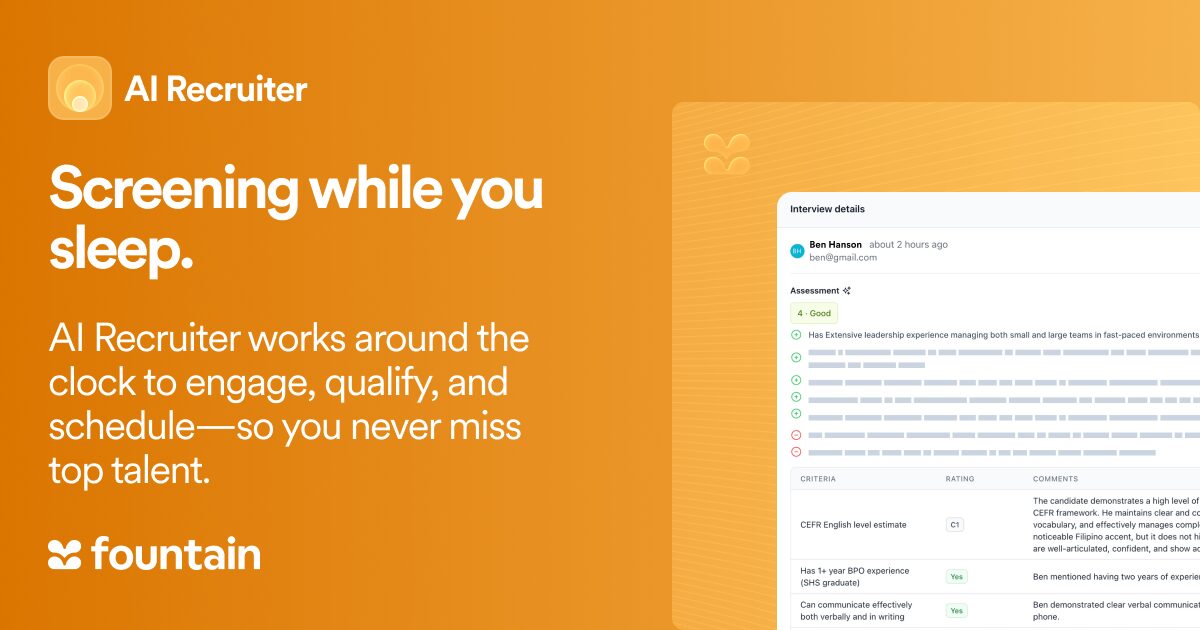
Cue coordinates the agents that carry each gap from plan to coverage. Anna, the AI Recruiter, runs voice and SMS screening at volume so recruiters aren’t scheduling every call. Emma, AI 24/7 Support, answers candidate questions and clears document blockers. Sam, AI Satisfaction, tracks post-hire sentiment and surfaces the retention signals that feed the next refresh, keeping 90-day attrition from breaking the next forecast.
The agents act on the platform underneath: ATS carries requisitions by location, Sourcing and CRM reactivate past applicants in short markets, Onboarding drives Day 1 readiness, and Shift & Scheduling confirms coverage against the local notice window.
Book a demo to see it on your own locations, including short-site flags, requisition routing, and Day 1 readiness by store.
Frequently asked questions about workforce planning strategy
What is a workforce planning strategy example?
A workforce planning strategy example is one site’s forecast, gap, and hiring actions worked end to end. The three above cover a seasonal QSR surge, chronic driver replacement at a last-mile operator, and four new grocery openings.
How is workforce planning different from headcount planning?
Headcount planning sets how many people the budget supports and at what cost, usually annually. Workforce planning covers which roles and skills the business needs, and where and when, over a longer horizon. Headcount planning is a subset of it.
How far ahead should you plan your workforce?
Use a forward-looking horizon refreshed quarterly, with monthly adjustments at fast-moving sites. Seasonal plans need their own backward schedule, since hiring starts well before a known demand peak.